Adam Leventhal's blog

Search
Close this search box.

Category: DTrace

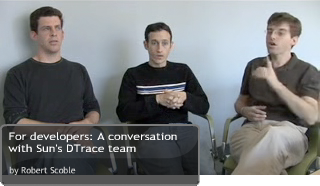
Robert Scoble was kind enough to interview us last week for the ScobleShow. Robert pretty much let us riff continuously for half an hour — we clearly haven’t been getting to talk about DTrace enough lately. I thought he would trim it down a bit, but like a scene from Hard Boiled, it’s all there.

This picture captures my favorite moment (around 16:23) during the interview as the three of us try to formulate a connection between DTrace and green computing…

… and this is as good a time as any to plug the talk Brendan and I will be giving at the end of the month at OSCON. We’ll be talk about how team DTrace was able to solve some nasty Ruby scalability problems at Twitter; it’s in the Ruby track, but the principles apply for analysis of performance problems in all languages.

People often ask about the future direction of DTrace, and while we have some stuff planned for the core infrastructure, the future is really about extending DTrace’s scope into every language, protocol, and application with new providers — and this development is being done by many different members of the DTrace community. An important goal of this new work is to have consistent providers that work predictably. To that end, Brendan and I have started to sketch out an array of providers so that we can build a consistent model.

In that vein, I recently integrated a provider for our iSCSI target into Solaris Nevada (build 69, and it should be in a Solaris 10 update, but don’t ask me which one). It’s an USDT provider so the process ID is appended to the name; you can use * to avoid typing the PID of the iSCSI target daemon. Here are the probes with their arguments (some of the names are obvious; for others you might need to refer to the iSCSI spec):

probe name args[0] args[1] args[2]
iscsi*:::async-send conninfo_t * iscsiinfo_t *
iscsi*:::login-command conninfo_t * iscsiinfo_t *
iscsi*:::login-response conninfo_t * iscsiinfo_t *
iscsi*:::logout-command conninfo_t * iscsiinfo_t *
iscsi*:::logout-response conninfo_t * iscsiinfo_t *
iscsi*:::data-receive conninfo_t * iscsiinfo_t *
iscsi*:::data-request conninfo_t * iscsiinfo_t *
iscsi*:::data-send conninfo_t * iscsiinfo_t *
iscsi*:::nop-receive conninfo_t * iscsiinfo_t *
iscsi*:::nop-send conninfo_t * iscsiinfo_t *
iscsi*:::scsi-command conninfo_t * iscsiinfo_t * iscsicmd_t *
iscsi*:::scsi-response conninfo_t * iscsiinfo_t *
iscsi*:::task-command conninfo_t * iscsiinfo_t *
iscsi*:::task-response conninfo_t * iscsiinfo_t *
iscsi*:::text-command conninfo_t * iscsiinfo_t *
iscsi*:::text-response conninfo_t * iscsiinfo_t *

The argument structures are defined as follows:

typedef struct conninfo {
string ci_local;        /* local host address */
string ci_remote;       /* remote host address */
string ci_protocol;     /* protocol (ipv4, ipv6, etc) */
} conninfo_t;
typedef struct iscsiinfo {
string ii_target;               /* target iqn */
string ii_initiator;            /* initiator iqn */
uint64_t ii_lun;                /* target logical unit number */
uint32_t ii_itt;                /* initiator task tag */
uint32_t ii_ttt;                /* target transfer tag */
uint32_t ii_cmdsn;              /* command sequence number */
uint32_t ii_statsn;             /* status sequence number */
uint32_t ii_datasn;             /* data sequence number */
uint32_t ii_datalen;            /* length of data payload */
uint32_t ii_flags;              /* probe-specific flags */
} iscsiinfo_t;
typedef struct iscsicmd {
uint64_t ic_len;        /* CDB length */
uint8_t *ic_cdb;        /* CDB data */
} iscsicmd_t;

Note that the arguments go from most generic (the connection for the application protocol) to most specific. As an aside, we’d like future protocol providers to make use of the conninfo_t so that one could write a simple script to see a table of frequent consumers for all protocols:

iscsi*:::,
http*:::,
cifs:::
{
@[args[0]->ci_remote] = count();
}

With the iSCSI provider you can quickly see which LUNs are most active:

iscsi*:::scsi-command
{
@[args[1]->ii_target] = count();
}

or the volume of data transmitted:

iscsi*:::data-send
{
@ = sum(args[1]->ii_datalen);
}

Brendan has been working on a bunch of iSCSI scripts — those are great for getting started examining iSCSI
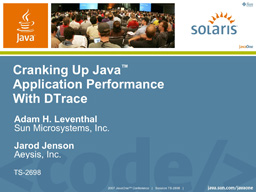
This year, Jarod Jenson and I gave an updated version of our DTrace for Java (technology-based applications) talk:

The biggest new feature that we demonstrated is the forthcoming Java Statically-Defined Tracing (JSDT) which will allow developers to embed stable probes in their code as we can do today in the kernel with SDT probes and in C and C++ applications with USDT probes. While you can already trace Java applications (and C and C++ applications), static probes let the developer embed stable and semantically rich points of instrumentation that allow the user to examine the application without needing to understand its implementation. The Java version of this is so new I had literally never seen it until Jarod gave a demonstration during our talk. The basic idea is that you can define a new probe by constructing a USDTProbe instance specifying the provider, function, probe name, and argument signature:

sun.dtrace.USDTProbe myprobe = new sun.dtrace.USDTProbe("myprovider", "myfunc", "myprobe", "ssl");

To fire the probe, you invoke the Call() method on the instance, and pass in the appropriate arguments.

Attendance was great, and we talked to a lot of people who had attended last year and had been getting mileage out of DTrace for Java. Next year, we’re hoping to give the updated version of this talk on Tuesday (rather than Friday for once) and invite people to bring in their applications for a tune-up; we’ll present the results in a case study-focussed talk on Friday.

The Texas Ranger himself, Jarod Jenson, has written a nice article about using the new DTrace probes in Java SE 6. If that’s up your alley, you should come to the talk Jarod and I will be giving at JavaOne in May. We’ll be talking about some of the new features in Java SE 6 and potentially previewing some new features slated for Java SE 7. This will be our third year at JavaOne — it’s great to see how much progress we’re making each year.


Technorati Tags:

An unsurprisingly common request on the DTrace discussion forum has been for updated documentation. People have been — on the whole — very pleased with the Solaris Dynamic Tracing Guide that we worked hard to produce, but I readily admit that we haven’t been nearly as diligent in updating it. OK: we haven’t updated it at all.

But we have been updating DTrace itself, adding new variables and functions, tacking on new features, adding new providers, and fixing bugs. But unless you’ve been scraping our putback logs, or reading between the lines on the discussion forum, these features haven’t necessarily been obvious. To that end, I’ve scraped the putback logs, and tried to tease out some of the bigger features, and put them all on the DTrace Change Log. We’ll try to keep this up to date so you can see what features are in the build of Solaris Nevada you’re running or the Solaris 10 release.

This is probably going to be handy in its own right and ameliorate the documentation gap, but we do still need to update the documentation. I’m torn between keeping it in SGML (or converting it to XML), and converting it to a wiki. The former has the disadvantage of being overly onerous to update (witness the complete lack of updates), while the latter prevents us from releasing it in printed form (unless someone knows of a tool that can turn a wiki into a book). If anyone from the community is interested in working on this project, it would be a tremendous help to every DTrace user and developer.


Technorati Tags:

I have this friend who might be most accurately described as a web developer. When DTrace was able to observe php he was interested. Me: “I should give you a demo some time.” Him: “Absolutely…”

When DTrace ticked Ruby off its list, he was more enthusiastic. Him: “Cool! I loves me the Ruby!” Me: “Let me know when you want that demo”.

The other day I got an IM from my friend. Him: “DTrace for JavaScript, eh?” Me: “How ’bout that, huh?” Him: “So when can I get that demo?”

Last week Brendan Gregg released Helper Monkey — a DTrace-enabled version of Mozilla’s Spider Monkey JavaScript engine. Why was this the tipping point for my friend the web developer? Probably not because he’s more fond of JavaScript than php or Ruby; much more likely, it’s because JavaScript is an observability atrocity. Even if you don’t use any probes in DTrace other than the ones associated with JavaScript, Helper Monkey is a galactic improvement on the state of JavaScript development. Consider the next 40,000 – 200,000 DTrace probes gravy.


Technorati Tags:

Recent Posts

April 17, 2024
January 13, 2024
December 29, 2023
February 12, 2017
December 18, 2016

Archives

Archives