Adam Leventhal's blog

Search
Close this search box.

Category: DTrace

The other day, there was an interesting post on the DTrace mailing list asking how to derive a process name from a pid. This really ought to be a built-in feature of D, but it isn’t (at least not yet). I hacked up a solution to the user’s problem by cribbing the algorithm from mdb’s ::pid2proc function whose source code you can find here. The basic idea is that you need to look up the pid in pidhash to get a chain of struct pid that you need to walk until you find the pid in question. This in turn gives you an index into procdir which is an array of pointers to proc structures. To find out more about these structures, poke around the source code or mdb -k which is what I did.

The code isn’t exactly gorgeous, but it gets the job done. It’s a good example of probe-local variables (also somewhat misleadingly called clause-local variables), and demonstrates how you can use them to communicate values between clauses associated with a given probe during a given firing. You can try it out by running dtrace -c <your-command> -s <this-script>.

BEGIN
{
this->pidp = `pidhash[$target & (`pid_hashsz - 1)];
this->pidname = "-error-";
}
/* Repeat this clause to accommodate longer hash chains. */
BEGIN
/this->pidp->pid_id != $target && this->pidp->pid_link != 0/
{
this->pidp = this->pidp->pid_link;
}
BEGIN
/this->pidp->pid_id != $target && this->pidp->pid_link == 0/
{
this->pidname = "-no such process-";
}
BEGIN
/this->pidp->pid_id != $target && this->pidp->pid_link != 0/
{
this->pidname = "-hash chain too long-";
}
BEGIN
/this->pidp->pid_id == $target/
{
/* Workaround for bug 6465277 */
this->slot = (*(uint32_t *)this->pidp) >> 8;
/* AHA! We finally have the proc_t. */
this->procp = `procdir[this->slot].pe_proc;
/* For this example, we'll grab the process name to print. */
this->pidname = this->procp->p_user.u_comm;
}
BEGIN
{
printf("%d %s", $target, this->pidname);
}

Note that the second clause is the bit that walks the hash chain. You can repeat this clause as many times as you think will be needed to traverse the hash chain — I really don’t have any guidance here, but I imagine that a few times should suffice. Alternatively, you could construct a tick probe that steps along the hash chain to avoid a fixed limit. DTrace attempts to keep easy things easy and make difficult things possible. As evidenced by this example, possible doesn’t necessarily correlate with beautiful.

As has been thoroughly recorded, Apple has included DTrace in Mac OS X. I’ve been using it as often as I have the opportunity, and it’s a joy to be able to use the fruits of our labor on another operating system. But I hit a rather surprising case recently which led me to discover a serious problem with Apple’s implementation.

A common trick with DTrace is to use a tick probe to report data periodically. For example, the following script reports the ten most frequently accessed files every 10 seconds:

io:::start
{
@[args[2]->fi_pathname] = count();
}
tick-10s
{
trunc(@, 10);
printa(@);
trunc(@, 0);
}

This was running fine, but it seemed as though sometimes (particularly with certain apps in the background) it would occasionally skip one of the ten second iterations. Odd. So I wrote the following script to see what was going on:

profile-1000
{
@ = count();
}
tick-1s
{
printa(@);
clear(@);
}

What this will do is fire a probe at 1000hz on all (logical) CPUs. Running this on a dual-core machine we’d expect to see it print out 2000 each time. Instead I saw this:

0  22369                         :tick-1s
1803
0  22369                         :tick-1s
1736
0  22369                         :tick-1s
1641
0  22369                         :tick-1s
3323
0  22369                         :tick-1s
1704
0  22369                         :tick-1s
1732
0  22369                         :tick-1s
1697
0  22369                         :tick-1s
5154

Kind of bizarre. The missing tick-1s probes explain the values over 2000, but weirder were the values so far under 2000. To explore a bit more I performed another DTrace experiment to see what applications were running when the profile probe fired:

# dtrace -n profile-997'{ @[execname] = count(); }'
dtrace: description 'profile-997' matched 1 probe
^C
Finder                                                            1
configd                                                           1
DirectoryServic                                                   2
GrowlHelperApp                                                    2
llipd                                                             2
launchd                                                           3
mDNSResponder                                                     3
fseventsd                                                         4
mds                                                               4
lsd                                                               5
ntpd                                                              6
kdcmond                                                           7
SystemUIServer                                                    8
dtrace                                                            8
loginwindow                                                       9
pvsnatd                                                          21
Dock                                                             41
Activity Monito                                                  45
pmTool                                                           52
Google Notifier                                                  60
Terminal                                                        153
WindowServer                                                    238
Safari                                                         1361
kernel_task                                                    4247

While there’s nothing suspicious about the output in itself, it was strange because I was listening to music at the time. With iTunes. Where was iTunes?
I ran the first experiment again and caused iTunes to do more work which yielded these results:

0  22369                         :tick-1s
3856
0  22369                         :tick-1s
1281
0  22369                         :tick-1s
4770
0  22369                         :tick-1s
2271

So what was iTunes doing? To answer that I again turned to DTrace and used the following enabling to see what functions were being called most frequently by iTunes (whose process ID was 332):

# dtrace -n 'pid332:::entry{ @[probefunc] = count(); }'
dtrace: description 'pid332:::entry' matched 264630 probes

I let it run for a while, made iTunes do some work, and the result when I stopped the script? Nothing. The expensive DTrace invocation clearly caused iTunes to do a lot more work, but DTrace was giving me no output.
Which started me thinking… did they? Surely not. They wouldn’t disable DTrace for certain applications.

But that’s exactly what Apple’s done with their DTrace implementation. The notion of true systemic tracing was a bit too egalitarian for their classist sensibilities so they added this glob of lard into dtrace_probe() — the heart of DTrace:

#if defined(__APPLE__)
/*
* If the thread on which this probe has fired belongs to a process marked P_LNOATTACH
* then this enabling is not permitted to observe it. Move along, nothing to see here.
*/
if (ISSET(current_proc()->p_lflag, P_LNOATTACH)) {
continue;
}
#endif /* __APPLE__ */

Wow. So Apple is explicitly preventing DTrace from examining or recording data for processes which don’t permit tracing. This is antithetical to the notion of systemic tracing, antithetical to the goals of DTrace, and antithetical to the spirit of open source. I’m sure this was inserted under pressure from ISVs, but that makes the pill no easier to swallow. To say that Apple has crippled DTrace on Mac OS X would be a bit alarmist, but they’ve certainly undermined its efficacy and, in doing do, unintentionally damaged some of its most basic functionality. To users of Mac OS X and of DTrace: Apple has done a service by porting DTrace, but let’s convince them to go one step further and port it properly.

It’s been more than a year since I first saw DTrace on Mac OS X, and now it’s at last generally available to the public. Not only did Apple port DTrace, but they’ve also included a bunch of USDT providers. Perl, Python, Ruby — they all ship in Leopard with built-in DTrace probes that allow developers to observe function calls, object allocation, and other points of interest from the perspective of that dynamic language. Apple did make some odd choices (e.g. no Java provider, spurious modifications to the publicly available providers, a different build process), but on the whole it’s very impressive.

Perhaps it was too much to hope for, but with Apple’s obvious affection for DTrace I thought they might include USDT probes for Safari. Specifically, probes in the JavaScript interpreter would empower developers in the same way they enabled Ruby, Perl, and Python developers. Fortunately, the folks at the Mozilla Foundation have already done the heavy lifting for Firefox — it was just a matter of compiling Firefox on Mac OS X 10.5 with DTrace enabled:

There were some minor modifications I had to make to the Firefox build process to get everything working, but it wasn’t too tricky. I’ll try to get a patch submitted this week, and then Firefox will have the same probes on Mac OS X that it does — thanks to Brendan’s early efforts — on Solaris. JavaScript developers take note: this is good news.


What if there were a port of DTrace to Linux?

What if there were a port of DTrace to Linux: could such a thing be done without violating either the GPL or CDDL? Read on before you jump right to the comments section to add your two cents.

In my last post, I discussed an attempt to create a DTrace knockoff in Linux, and suggested that a port might be possible. Naively, I hoped that comments would examine the heart of my argument, bemoan the apparent NIH in the Linux knockoff, regret the misappropriation of slideware, and maybe discuss some technical details — anything but dwell on licensing issues.

For this post, I welcome the debate. Open source licenses are important, and the choice can have a profound impact on the success of the software and the community. But conversations comparing the excruciating minutia of one license and another are exhausting, and usually become pointless in a hurry. Having a concrete subject might lead to a productive conversation.

DTrace Port Details

Just for the sake of discussion, let’s say that Google decide to port DTrace to Linux (everyone loves Google, right?). This isn’t so far fetched: Google uses Linux internally, maybe they’re using SystemTap, maybe they’re not happy with it, but they definitely (probably) care about dynamic tracing (just like all good system administrators and developers should). So suppose some engineers at Google take the following (purely hypothetical) steps:

Kernel Hooks

DTrace has a little bit of functionality that lives in the core kernel. The code to deal with invalid memory accesses, some glue between the kernel’s dynamic linker and some of the DTrace instrumentation providers, and some simple, low-level routines cover the bulk of it. My guess is there are about 1500 lines of code all told: not trivial, but hardly insurmountable. Google implements these facilities in a manner designed to allow the results to be licensed under the GPL. For example, I think it would be sufficient for someone to draft a specification and for someone else to implement it so long as the person implementing it hadn’t seen the CDDL version. Google then posts the patch publically.

DTrace Kernel Modules

The other DTrace kernel components are divided into several loadable kernel modules. There’s the main DTrace module and then the instrumentation provider modules that connect to the core framework through an internal interface. These constitute the vast majority of the in-kernel DTrace code. Google modifies these to use slightly different interfaces (e.g. mutex_enter() becomes mutex_lock()); the final result is a collection of kernel modules still licensed under the CDDL. Of course, Google posts any modifications to CDDL files.

DTrace Libraries and Commands

It wouldn’t happen for free, but the DTrace user-land components could just be directly ported. I don’t believe there are any legal issues here.

So let’s say that this is Google’s DTrace port: their own hacked up kernel, some kernel modules operating under a non-GPL license, and some user-land components (also under a non-GPL license, but, again, I don’t think that matters). Now some questions:

1. Legal To Run?

If Google assembled such a system, would it be legal to run on a development desktop machine? It seems to violate the GPL no more than, say, the nVidia drivers (which are presumably also running on that same desktop). What if Google installed the port on a customer-facing machine? Are there any additional legal complications there? My vote: legit.

2. Legal To Distribute?

Google distributes the Linux kernel patch (so that others can construct an identical kernel), and elsewhere they distribute the Linux-ready DTrace modules (in binary or source form): would that violate either license? It seems that it would potentially violate the GPL if a full system with both components were distributed together, but distributed individually it would certainly be fine. My vote: legit, but straying into a bit of a gray area.

3. Patch Accepted?

I’m really just putting this here for completeness. Google then submits the changes to the Linux kernel and tries to get them accepted upstream. There seems to be a precedent for the Linux kernel not accepting code that’s there merely to support non-GPL kernel modules, so I doubt this would fly. My vote: not gonna happen.

4. No Source?

What if Google didn’t supply the source code to either component, and didn’t distribute any of it externally? My vote: legal, but morally bankrupt.

You Make The Call

So what do you think? Note that I’m not asking if it would be “good”, and I’m not concluding that this would obviate the need for direct support for a native dynamic tracing framework in the Linux kernel. What I want to know is whether or not this DTrace port to Linux would be legal (and why)? If not, what would happen to poor Google (e.g. would FSF ninjas storm the Googleplex)?

If you care to comment, please include some brief statement about your legal expertise. I for one am not a lawyer, have no legal background, have read both the GPL and CDDL and have a basic understanding of both, but claim to be an authority in neither. If you don’t include some information with regard to that, I may delete your comment.

Update 8/6/2007: Those of you interested in this entry may also want to check out my next entry on the legality of a hypothetical port of DTrace to Linux.


Tools We Wish We Had — OSCON 7/26/2007

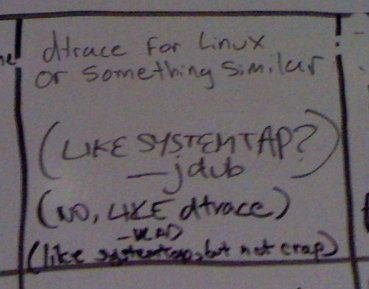
Last week at OSCON someone set up a whiteboard with the heading “Tools We Wish We Had”. People added entries (wiki-style); this one in particular caught my eye:

dtrace for Linux
or something similar

(LIKE SYSTEMTAP?)
– jdub
(NO, LIKE dtrace)
– VLAD
(like systemtap, but not crap)

DTrace

So what exactly were they asking for? DTrace is the tool developers and sysadmins have always needed — whether they knew it or not — but weren’t able to express in words let alone code. Most simply (and least humbly) DTrace lets you express a question about nearly any aspect of the system and get the answer in a simple and concise form. And — this is important — you can do it safely on machines running in production as well as in development. With DTrace, you can look at the highest level software such as Ruby (as was the subject of my talk at OSCON) through all the layers of the software stack down to the lowest level kernel facilities such as I/O and scheduling. This systemic scope, production focus, and arbitrary flexibility are completely new, and provide literally unprecedented observability into complex software systems. We’re scientists, we’re detectives — DTrace lets us form hypotheses, and prove or disprove them in an instant until we’ve come to an understanding of the problem, until we’ve solved the crime. Of course anyone using Linux would love a tool like that — especially because DTrace is already available on Mac OS X, Solaris, and FreeBSD.

SystemTap

So is SystemTap like DTrace? To understand SystemTap, it’s worth touching on the history of DTrace: Bryan cut the first code for DTrace in October of 2001; Mike tagged in moments later, and I joined up after a bit. In September of 2003 we integrated DTrace into Solaris 10 which first became available to customers in November of 2003 and formally shipped and was open-sourced in January of 2005. Almost instantly we started to see the impact in the field. In terms of performance, Solaris has strong points and weak points; with DTrace we were suddenly able to understand where those bottlenecks were on customer systems and beat out other vendors by improving our performance — not in weeks or months, but literally in a few hours. Now, I’m not saying that DTrace was the silver bullet by which all enemies were slain — that’s clearly not the case — but it was turning some heads and winning some deals.

Now, this bit involves some hearsay and conjecture[1], but apparently some managers of significance at Red Hat, IBM, and Intel started to take note. “We’ve got to do something about this DTrace,” one of them undoubtedly said with a snarl (as an underling dragged off the fresh corpse of an unlucky messenger). SystemTap was a direct reaction to the results we were achieving with DTrace — not to DTrace as an innovative technology.

When the project started in January of 2005, early discussion by the SystemTap team referred to “inspiration” that they derived from DTrace. They had a mandate to come up with an equivalent, so I assumed that they had spent the time to truly understand DTrace: to come up with an equivalent for DTrace — or really to duplicate any technology — the first step is to understand what it is completely. From day one, DTrace was designed to be used on mission critical systems, to always be safe, to induce no overhead when not in use, to allow for arbitrary data gathering, and to have systemic scope from the kernel to user-land and on up the stack into higher level languages. Those fundamental constraints led to some important, and non-obvious design decisions (e.g. our own language “D”, a micro virtual machine, conservative probe point selection).


SystemTap — the “Sorny” of dynamic tracing

Instead of taking the time to understand DTrace, and instead of using it and scouring the documentation, SystemTap charged ahead, completely missing the boat on safety with an architecture which is nearly impossible to secure (e.g. running a SystemTap script drops in a generated kernel module). Truly systemic scope remains an elusive goal as they’re only toe-deep in user-land (forget about Ruby, Java, python, etc). And innovations in DTrace such as scalable data aggregation and speculative tracing are replicated poorly if at all. By failing to examine DTrace, and by rushing to have some sort of response, SystemTap isn’t like DTrace: it’s a knockoff.

Amusingly, in an apparent attempt to salvage their self-respect, the SystemTap team later renounced their inspiration. Despite frequent mentions of DTrace in their early meetings and email, it turns out, DTrace didn’t actually inspire them much at all:

CVSROOT:	/cvs/systemtap
Module name:	src
Changes by:	kenistoj@sourceware.org	2006-11-02 23:03:09
Modified files:
.              : stap.1.in
Log message:
Removed refs to dtrace, to which we were giving undue credit in terms of
"inspiration."

you’re not my real dad! <slam>

Bad Artists Copy…

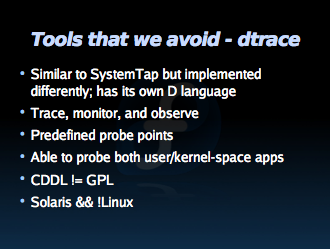
So uninspired was the SystemTap team by DTrace, that they don’t even advocate its use according to a presentation on profiling applications (“Tools that we avoid – dtrace [sic]”). In that same presentation there’s an example of a SystemTap-based tool called udpstat.stp:

$ udpstat.stp
UDP_out  UDP_outErr  UDP_in  UDP_inErr  UDP_noPort
0           0       0          0           0
0           0       0          0           0
4           0       0          0           0
5           0       0          0           0
5           0       0          0           0

… whose output was likely “inspired” by udpstat.d — part of the DTraceToolkit by Brendan Gregg:

# udpstat.d
UDP_out  UDP_outErr   UDP_in  UDP_inErr  UDP_noPort
0           0        0          0           1
0           0        0          0           2
0           0        0          0           0
1165           0        2          0           0

In another act of imitation reminiscent of liberal teenage borrowing from wikipedia, take a look at Eugene Teo’s slides from Red Hat Summit 2007 as compared with Brendan’s DTrace Topics Intro wiki (the former apparently being generated by applying a sed script to the latter). For example:

What isn’t SystemTap

  • SystemTap isn’t sentient; requires user thinking process
  • SystemTap isn’t a replacement for any existing tools

What isn’t DTrace

  • DTrace isn’t a replacement for kstat or SMNP
    • kstat already provides inexpensive long term monitoring.
  • DTrace isn’t sentient, it needs to borrow your brain to do the thinking
  • DTrace isn’t “dTrace”

… Great Artists Steal

While some have chosen the knockoff route, others have taken the time to analyze what DTrace does, understood the need, and decided that the best DTrace equivalent would be… DTrace. As with the rest of Solaris, DTrace is open source so developers and customers are excited about porting. Just a few days ago there were a couple of interesting blog posts (here and here) by users of ONTAP, NetApp’s appliance OS, not for a DTrace equivalent, but for a port of DTrace itself.

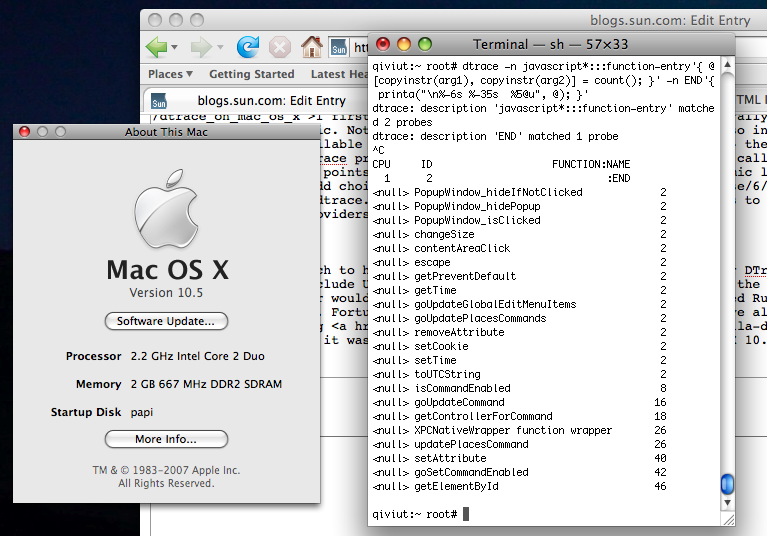
DTrace is already available in the developer builds of Mac OS X 10.5, and there’s a functional port for FreeBSD. I don’t think it’s a stretch to say that DTrace itself is becoming the measuring stick — if not the standard. Why reinvent the wheel when you can port it?

Time For Standards

At the end of my talk last week someone asked if there was a port of DTrace to Linux (not entirely surprising since OSCON has a big Linux user contingent). I told him to ask the Linux bigwigs (several of them were also at the conference); after all, we didn’t do the port to Mac OS X, and we didn’t do the port to FreeBSD. We did extend our help to those developers, and they, in turn, helped DTrace by growing the community and through direct contributions[2].

We love to see DTrace on other operating systems, and we’re happy to help.

So to the pretenders: enough already with the knockoffs. Your users want DTrace, you obviously want what DTrace offers, and the entire DTrace team and community are eager to help. I’m sure there’s been some FUD about license incompatibilities, but it’s certainly Sun’s position (as stated by Sun’s CEO Jonathan Schwartz at OSCON 2005) that such a port wouldn’t violate the OpenSolaris license. And even closed-source kernel components are tolerated from the likes of Symantec (nee Veritas) and nVidia. Linux has been a champion of standards, eschewing proprietary solutions for free and open standards. DTrace might not yet be a standard, but a DTrace knockoff never will be.

[1] … those are kinds of evidence
[2] including posts on the DTrace discussion forum comprehensible only to me and James

I just got back from OSCON, a conference on Open Source that O’Reilly hosts in Portland annually. The conference offered some interesting content and side-shows with some notable highlights (more on those in the next few days). Brendan and I gave a presentation on how a crew from Sun dropped in on Twitter to help them use DTrace to discover some nasty performance problems.

Here’s the presentation along with the D scripts and load generators we used for the talk.

Recent Posts

April 17, 2024
January 13, 2024
December 29, 2023
February 12, 2017
December 18, 2016

Archives

Archives