Search
Close this search box.

Category: DTrace

DTrace’s User-land Statically-Defined Tracing (USDT) was… kind of an accident. Bryan has (kindly) retconned the genesis of USDT as a way to understand dynamic languages[citation needed]. Indeed, it’s been essential for that, but its origins were much less ambitious or prescient.

Way back in the 1990s(!) Jeff Bonwick had created a program called lockstat(1M) for live instrumentation of kernel locking primitives (“live” as distinct from “dynamic” in that while the instrumentation could be turned on and off, the data payloads were pretty much static). This was incredibly useful! What locks were hot? Where were they contended? New observability led to new performance fixes. When we built DTrace, we incorporated its instrumentation as the lockstat provider.  After building user-land tracing with the pid provider, it seemed like an obvious step to build a plockstat(1M) command to understand user-land locking primitives. So I built it. And, my goodness, was the first iteration of that a disaster. A total mess. Special cases on special cases with unholy knowledge sprinkled everywhere. We yanked that out of the first integration of DTrace and went back to the drawing board. What we came up with was USDT, the first provider of which was plockstat whose probes are consumed by the eponymous command.

Bryan and I touched on this somewhere in the 2+ hours of DTrace history we recorded back in September:

Years passed as they do, and USDT turned out to be very very very useful. At Oxide, we wanted that usefulness in the Rust code we’re writing, so my colleague, Ben Naecker, and I built a usdt crate. While we have probes in lots of places, knowledge had passed more or less word-of-mouth. Shocking! To remedy this, at the last Oxide all-company event, Ben and I put together a little slide deck on inserting USDT probes in Rust code, using those probes (spoiler: here’s a new cause for frustration with async Rust), and an exercise to try it out. Enjoy!

(tl;dr add USDT probes where you have log statements and you’ll probably thank yourself later.)

When Apple announced their new file system, APFS, in June, I hustled to be in the front row of the WWDC presentation, questions with the presenters, and then the open Q&A session. I took a week to write up my notes which turned into as 12 page behemoth of a blog post — longer than my college thesis. Despite reassurances from the tweeps, I was sure that the blog post was an order of magnitude longer than the modern attention span. I was wrong; so wrong that Ars Technica wanted to republish the blog post. Never underestimate the interest in all things Apple.

In that piece I left one big thread dangling. Apple shipped APFS as a technology preview, but they left out access to one of the biggest new features: snapshots. Digging around I noticed that there was a curiously named new system call, “fs_snapshot”, but explicitly didn’t investigate: the post was already too long (I thought), I had spent enough time on it, and someone else (surely! surely?) would want to pull on that thread.

Slow News Day

Every so often I’d poke around for APFS news, but there was very little new. Last month folks discovered that APFS was coming to iOS sooner rather than later. But there wasn’t anything new to play with or any revelations on how APFS would work.

I would search for “APFS snapshots”, “fs_snapshot”, anything I could think of to see if anyone had figured out how to make snapshots work on APFS. Nothing.

A few weekends ago, I decided to yank on that thread myself.

Prometheus

I started from the system call, wandered through Apple’s open source kernel, leaned heavily on DTrace, and eventually figured it out. Apple had shipped snapshots in APFS, they just hadn’t made it easy to get there. The folks at Ars were excited for a follow-up, and my investigation turned into this: “Testing out snapshots in Apple’s next-generation APFS file system.”

Snapshots were there; the APIs were laid bare; I was going to bring fire to all the Mac fans; John Siracusa and Andy Ihnatko would carry me on their shoulders down the streets of the Internet.

Sisyphus

On the eve that this new piece was about to run I was nervously scrolling through Twitter as I took the bus home from work. Now that I had invested the time to research and write-up APFS snapshots I didn’t want someone else beating me to the punch.

Then I found this and my heart dropped:


Skim past the craziness of MFS and the hairball of HFS, and start digging through the APFS section. Slide 49, “APFS Snapshots” and there it is “apfs_snapshot” — not a tool that anyone laboriously reverse engineered, deciphering system calls and semi-published APIs — a tool shipped from Apple and included in macOS by default. F — .

Apple had secreted this utility away (along with some others) in /System/Library/Filesystems/apfs.fs/Contents/Resources/

What To Do?

The article that was initially about a glorious act of discovery had become an article about the reinvention of the wheel. Conversely, vanishingly few people would recognize this as rediscovery since the apfs_snapshot tool was so obscure (9 hits on Google!).

We toned down the already modest chest-thumping and published the article this morning to a pretty nice response so far. I might have happier as an FAKE NEWS Prometheus, blissfully unaware of the pre-existence of fire, but I would have been mortified when the inevitable commenter, one of the few who had used apfs_snapshot, crushed me with my own boulder.

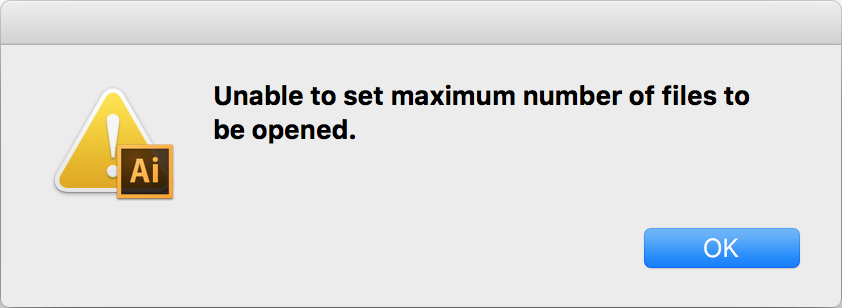
I had been procrastinating making the family holiday card. It was a combination of having a lot on my plate and dreading the formulation of our annual note recapping the year; there were some great moments, but I’m glad I don’t have to do 2016 again. It was just before midnight and either I’d make the card that night or leave an empty space on our friends’ refrigerators. Adobe Illustrator had other ideas:

Unable to set maximum number of files to be opened.

I’m not the first person to hit this. The problem seems to have existed since CS6 was released in 2016. None of the solutions was working for me, and — inspired by Sara Mauskopf’s excellent post — I was rapidly running out of the time bounds for the project. Enough; I’d just DTrace it.

A colleague scoffed the other day, “I mean, how often do you actually use DTrace?” In his mind DTrace was for big systems, critical system, when dollars and lives were at stake. My reply: I use DTrace every day. I can’t imagine developing software without DTrace, and I use it when my laptop (not infrequently) does something inexplicable (I’m forever grateful to the Apple team that ported it to Mac OS X).

First I wanted to make sure I had the name of the Illustrator process right:

$ sudo dtrace -n ‘syscall:::entry{ @[execname] = count(); }’
dtrace: description ‘syscall:::entry’ matched 500 probes
^C
pboard 1
watchdogd 2
awdd 3
...
com.apple.WebKit 7065
Google Chrome He 7128
Google Chrome 8099
Adobe Illustrato 36674

Glad I checked: “Adobe Illustrato”. Now we can be pretty sure that Illustrator is failing on setrlimit(2) and blowing up as result. Let’s confirm that it is in fact returning -1:

$ sudo dtrace -n 'syscall::setrlimit:return/execname == "Adobe Illustrato"/{ printf("%d %d", arg1, errno); }'
dtrace: description 'syscall::setrlimit:return' matched 1 probe
CPU     ID                    FUNCTION:NAME
  0    532                 setrlimit:return -1 1

There it is. And setrlimit(2) is failing with errno 1 which is EPERM (value too high for non-root user). I already tuned up the files limit pretty high. Let’s confirm that it is in fact setting the files limit and check the value to which it’s being set. To write this script I looked at the documentation for setrlimit(2) (hooray for man pages!) to determine that the position of the resource parameter (arg0) and the type of the value parameter (struct rlimit). I needed the DTrace copyin() subroutine to grab the structure from the process’s address space:

$ sudo dtrace -n 'syscall::setrlimit:entry/execname == "Adobe Illustrato"/{ this->r = *(struct rlimit *)copyin(arg1, sizeof (struct rlimit)); printf("%x %x %x", arg0, this->r.rlim_cur, this->r.rlim_max);  }'
dtrace: description 'syscall::setrlimit:entry' matched 1 probe
CPU     ID                    FUNCTION:NAME
  0    531                 setrlimit:entry 1008 2800 7fffffffffffffff

Looking through /usr/include/sys/resource.h we can see that 1008 corresponds to the number of files (RLIMIT_NOFILE | _RLIMIT_POSIX_FLAG). Illustrator is trying to set that value to 0x7fffffffffffffff or 2⁶³-1. Apparently too big; I filed any latent curiosity for another day.

The quickest solution was to use DTrace again to whack a smaller number into that struct rlimit. Easy:

$ sudo dtrace -w -n 'syscall::setrlimit:entry/execname == "Adobe Illustrato"/{ this->i = (rlim_t *)alloca(sizeof (rlim_t)); *this->i = 10000; copyout(this->i, arg1 + sizeof (rlim_t), sizeof (rlim_t)); }'
dtrace: description 'syscall::setrlimit:entry' matched 1 probe
dtrace: could not enable tracing: Permission denied

Oh right. Thank you SIP. This isa new laptop (at least a new motherboard due to some bizarre issue) which probably contributed to Illustrator not working when once it did. Because it’s new I haven’t yet disabled the part of SIP that prevents you from using DTrace on the kernel or in destructive mode (e.g. copyout()). It’s easy enough to disable, but I’m reboot-phobic — I hate having to restart my terminals — so I went to plan B: lldb.

First I used DTrace to find the code that was calling setrlimit(2): using some knowledge of the x86 ISA/ABI:

$ sudo dtrace -n 'syscall::setrlimit:return/execname == "Adobe Illustrato" && arg1 == -1/{ printf("%x", *(uintptr_t *)copyin(uregs[R_RSP], sizeof (uintptr_t)) - 5) }'
dtrace: description 'syscall::setrlimit:return' matched 1 probe
CPU     ID                    FUNCTION:NAME
  0    532                 setrlimit:return 1006e5b72
  0    532                 setrlimit:return 1006e5b72

I ran it a few times to confirm the address of the call instruction and to make sure the location wasn’t being randomized. If I wasn’t in a rush I might have patched the binary, but Apple’s Mach-O Object format always confuses me. Instead I used lldb to replace the call with a store of 0 to %eax (to evince a successful return value) and some nops as padding (hex values I remember due to personal deficiencies):

(lldb) break set -n _init
Breakpoint 1: 47 locations.
(lldb) run
...
(lldb) di -s 0x1006e5b72 -c 1
0x1006e5b72: callq  0x1011628e0     ; symbol stub for: setrlimit
(lldb) memory write 0x1006e5b72 0x31 0xc0 0x90 0x90 0x90
(lldb) di -s 0x1006e5b72 -c 4
0x1006e5b72: xorl   %eax, %eax
0x1006e5b74: nop
0x1006e5b75: nop
0x1006e5b76: nop

Next I just process detach and got on with making that holiday card…

DTrace Every Day

DTrace was designed for solving hard problems on critical systems, but the need to understand how systems behave exists in development and on consumer systems. Just because you didn’t write a program doesn’t mean you can’t fix it.

We built DTrace to solve problems; at the start, the problems we understood best were our own. In the Solaris Kernel Group we started by instrumenting the kernel and system calls, the user/kernel boundary. Early use required detailed knowledge of kernel internals. As DTrace use grew—within the team, in Sun and then beyond—we extended DTrace to turn every function and every instruction in user programs into probes. We added stable points of instrumentation both in the kernel and in user-land so that no deep knowledge of program or kernel internals would be required.

Oracle has been evolving their port of DTrace to OEL, prioritizing the stable points of instrumentation most relevant for the widest group of users. While DTrace started with providers that unlocked tens of thousands of points of instrumentation, the Oracle port enables a small number of comprehensible probes. Since I last tried out their port they’ve fixed some bugs, and added support for stable I/O and process probes, as well as user-land static probes.

[root@screven ~]# uname -a
Linux screven 3.8.13-16.el6uek.x86_64 #1 SMP Fri Sep 20 11:54:42 PDT 2013 x86_64 x86_64 x86_64 GNU/Linux
[root@screven ~]# cat test.d
provider test {
        probe foo(int);
};
[root@screven ~]# cat main.c
#include "test.h"

int
main(int argc, char **argv)
{
        TEST_FOO(100);
        return (0);
}
[root@screven ~]# dtrace -h -s test.d
[root@screven ~]# gcc -c main.c
[root@screven ~]# dtrace -G -s test.d main.o
[root@screven ~]# gcc -o main main.o test.o
[root@screven ~]# dtrace -c ./main -n 'test$target:::foo{ trace(arg0); }'
dtrace: description 'test$target:::foo' matched 1 probe
CPU     ID                    FUNCTION:NAME
  0    643                         main:foo               100

USDT, as it’s called, was a relatively late addition in the initial development of DTrace. We added it initially to support probes in user-land locking primitives (the plockstat(1M) command uses it just as the lockstat(1M) command was converted to use kernel SDT probes). We were right in thinking that USDT would be useful for providing probes in infrastructure software such as Apache and MySQL; we didn’t anticipate how incredibly valuable it would be for supporting dynamic languages such as javascript (including Node), python, java, and bash.

USDT built on both the learning and code from years of DTrace development. By effectively starting there, OEL benefits from a decade of integrations and investigations. DTrace users on all platforms will benefit from the growth of our community. I look forward to seeing the new investigations on OEL and new integrations in all types of applications.

At the illumos hackathon last week, Robert Mustacchi and I prototyped better support for manipulating user-land structures. As anyone who’s used it knows, DTrace is currently very kernel-centric — this both reflects the reality of how operating systems and DTrace are constructed, and the origins of DTrace itself in the Solaris Kernel Group. Discussions at dtrace.conf(12) this spring prompted me to chart a path to better user-land support. This prototype of copyin-automagic was a first step.

What we implemented was a new ‘user’ keyword to denote that a type is a user-land structure. For example, let’s say we had the address of a 4-byte integer; today we’d access its value using copyin():

this->i = *(int *)copyin(this->addr, sizeof (int));

With our prototype, this gets simpler and more intuitive:

this->i = *(user int *)addr;

The impact is even more apparent when it comes to pointer chasing through structures. Today if we need to get to the third element of a linked list, the D code would look like this:

this->p = (node_t *)copyin(this->addr, sizeof (node_t));
this->p = (node_t *)copyin((uintptr_t)this->p->next, sizeof (node_t));
trace(this->p->value);

Again, it’s much simpler with the user keyword:

this->p = (user node_t *)this->addr;
trace(this->p->next->next->value);

D programs are compiled into a series of instructions — DIF — that are executed by the code DTrace framework when probes fire. We use the new keyword to generate instructions that load from the address space of the currently executing process rather than that of the kernel.

Adding a new keyword feels a little clunky, and I’m not sure if it’s the right way forward, but it does demonstrate a simpler model for accessing user-land structures, and was a critical first step. We already have three main sources of user-land values; the next steps are to make use of those.

Types for system calls

Arguments to system calls (mostly) have well-known types. Indeed those types are encoded in truss in excruciating and exotic detail. We should educate DTrace about those types. What I’d propose is that we create a single repository of all system call metadata. This could be, for example, and XML file that listed every system call, its name, code, subcode, types, etc. Of course we could use that as the source of type information for the syscall provider, but we could also use that to generate everything from the decoding tables in truss to the libc and kernel stubs for system calls.

As an aside, there are a couple of system calls whose parameter types — ioctl(2) is the obvious example. It would be interesting to assess the utility of an ioctl provider whose probes would be the various codes that are passed as the second parameter. Truss already has this information; why not DTrace?

Types for the pid provider

Another obvious source of type information is the process being traced. When a user specifies the -p or -c option to dtrace(1M) we’re examining a particular process, and that process can have embedded type information. We could use those types and implicitly identify them as belonging to user-space rather than the kernel. Pid provider probes correspond to the entry and return from user-land functions; we could identify the appropriate types for those parameters. We could simplify it further by doing all type handling in libdtrace (in user-land) rather than pushing the types into the kernel.

Types for USDT

User-land statically defined tracing — tracepoints explicitly inserted into code — can already have types associated with them. A first step would be to implicitly identify those types as belonging to user-land. I believe that this could even be done without adversely affecting existing scripts.

Thorny issues

While there are some clear paths forward, there are some tricky issues that remain. In particular that processes can have different data models — 32-bit v. 64-bit — presents a real challenge. Both the width of a load and offsets into structures change depending on the process that’s running. There might be some shortcuts for system calls, and we might be able to constrain the problem for the pid provider by requiring -p or -c, or we might have to compile our D program twice and then choose which version to run based on the data model of the process. In the spirit of the hackathon, Robert and I punted for our ‘user’ keyword prototype, but these problems need to be well understood and sufficiently solved.

Next steps

I’ll be working on some of these problems on the back burner; I’m especially interested in the Grand Unified Syscall Project — an idea I’ve been touting for more years than I care to relate — to bring types to the syscall provider. If you have ideas for user-land tracing with DTrace, or want to work on anything I’ve mention, leave a comment or drop me a note.

The mantra as we initially developed DTrace was to make impossible things possible, not easy things easier. Since codifying that, the tendency toward the latter in developer tools has been apparent. Our focus on the former however has left certain usability burrs that stymie newbies, and annoy vets. Much of the DTrace development of late has focused on a middle category: simplifying hard things that should be simple.

The print() action

In that vein, my colleague, Eric Schrock, added the print() action to DTrace back in November. Before then, my workflow used to look like this:

  • “I want to trace xdr_bytes()
  • Drop into mdb(1) to print out the structure I want to examine
  • Write a D script to emit the members I’m interested in:
fbt::xdr_bytes:entry
{
        trace(args[0]->x_base);
        trace(args[0]->x_handy);
}

Repeat times a thousand, allow for errors, iterate on chased pointers, and sum up the time. With Eric’s fix, DTrace is a lot easier to use:

  • “I want to trace xdr_bytes()
  • Boom:
fbt::xdr_bytes:entry
{
        print(args[0]);
}

print() for translated types

Of course, in addition to tracing any kernel function, DTrace has stable probes that identify points of well-known, (reasonably) well-documented activity. Those probes don’t correspond to kernel functions so mdb isn’t as useful. The workflow is a little more annoying:

  • “I want to trace IO”
  • either
    • google “dtrace io provider”, find the argument and the type definitions
  • or (more often)
    • dtrace -lvn io::: to see the type names
    • less /usr/lib/dtrace/io.d to find the type definitions
  • write the D script:
io:::start
{
        trace(args[1]->dev_name);
        trace(args[1]->dev_pathname);
}

Repeat another thousand, much more annoying times.

Unfortunately, print() wasn’t as helpful in this case:

# dtrace -n 'io:::start{ print(*args[1]); }'
dtrace: invalid probe specifier io:::start{ trace(*args[1]); }: print( ) may not be applied to a dynamic expression

Stable probes such as the io:::start probe can use translated arguments, synthetic types that DTrace populates with stable data from the unstable underlying implementation. For example, despite very different implementations, the io:::start provider exposes the same data on illumos, FreeBSD, Mac OS X, and Oracle Solaris. Parameters are effectively translated one at a time; the * (dereference) operator was invalid for these expressions.

In a recent push to illumos, I added this support:

# dtrace -n 'io:::start{ print(*args[1]); }'
dtrace: description 'io:::start' matched 6 probes
CPU ID FUNCTION:NAME
0 11307 bdev_strategy:start devinfo_t {
    int dev_major = 0x62
    int dev_minor = 0x40
    int dev_instance = 0x1
    string dev_name = [ "sd" ]
    string dev_statname = [ "sd1" ]
    string dev_pathname = [ "/devices/pci@0,0/pci15ad,1976@10/sd@0,0:a" ]
}

Between Eric’s addition and my own, my most commonly encountered DTrace annoyances are no more.

Behind the scenes

For the DTrace super-nerds out there, I thought I’d share a bit of the implementation. In order to trace() or print() an expression, it needs to exist in memory somewhere. Translated types don’t exist in memory, rather individual members are translated statically. We can see this in the output of the DTrace DIF (D intermediate form) disassembler:

# dtrace -n 'io:::start{ trace(args[1]->dev_name); }' -Se
DIFO 0x75e940 returns string (unknown) by ref (size 256)
OFF OPCODE INSTRUCTION
00: 25000001 setx DT_INTEGER[0], %r1 ! 0x0
01: 28000101 ldga DT_VAR(0), %r1, %r1
02: 0e010002 mov %r1, %r2
03: 25000103 setx DT_INTEGER[1], %r3 ! 0xe0
04: 07020302 add %r2, %r3, %r2
05: 22020002 ldx [%r2], %r2
06: 25000003 setx DT_INTEGER[0], %r3 ! 0x0
07: 0f020300 cmp %r2, %r3
08: 1200000b be 11
09: 0e000002 mov %r0, %r2
10: 1100000c ba 12
11: 25000202 setx DT_INTEGER[2], %r2 ! 0x1
12: 10020000 tst %r2
13: 12000011 be 17
14: 26000102 sets DT_STRING[1], %r2 ! "nfs"
15: 0e020002 mov %r2, %r2
16: 1100001e ba 30
17: 25000302 setx DT_INTEGER[3], %r2 ! 0xfffffffffc031110
18: 22020002 ldx [%r2], %r2
19: 0e010003 mov %r1, %r3
20: 25000404 setx DT_INTEGER[4], %r4 ! 0xa8
21: 07030403 add %r3, %r4, %r3
22: 22030003 ldx [%r3], %r3
23: 33000000 flushts
24: 31000003 pushtv DT_TYPE(0), %r3 ! DT_TYPE(0) = D type
25: 2f001403 call DIF_SUBR(20), %r3 ! getmajor
26: 25000504 setx DT_INTEGER[5], %r4 ! 0x70
27: 08030403 mul %r3, %r4, %r3
28: 07020302 add %r2, %r3, %r2
29: 22020002 ldx [%r2], %r2
30: 23000002 ret %r2

In this case, this logic comes from /usr/lib/io.d, and — in particular — this translation:

        dev_name = B->b_dip == NULL ? "nfs" :
            stringof(`devnamesp[getmajor(B->b_edev)].dn_name);

To implement allow trace() and print() to work on translated types, we now generate code to first use the DTrace build-in alloca() function to get some scratch space, and then generate the translation for each member of the translated type. For example:

# dtrace -n 'io:::start{ print(*args[1]); }' -Se
DIFO 0x9466b0 returns D type (struct) by ref (size 780)
OFF OPCODE INSTRUCTION
00: 25000001 setx DT_INTEGER[0], %r1 ! 0x0
01: 28000101 ldga DT_VAR(0), %r1, %r1
02: 25000102 setx DT_INTEGER[1], %r2 ! 0x30c
03: 33000000 flushts
04: 31000002 pushtv DT_TYPE(0), %r2 ! DT_TYPE(0) = D type
05: 2f000f02 call DIF_SUBR(15), %r2 ! alloca
06: 0e010003 mov %r1, %r3
07: 25000204 setx DT_INTEGER[2], %r4 ! 0xe0
08: 07030403 add %r3, %r4, %r3
09: 22030003 ldx [%r3], %r3
10: 25000004 setx DT_INTEGER[0], %r4 ! 0x0
11: 0f030400 cmp %r3, %r4
12: 1300000f bne 15
13: 0e000003 mov %r0, %r3
14: 11000010 ba 16
15: 25000303 setx DT_INTEGER[3], %r3 ! 0x1
...
316: 2f001603 call DIF_SUBR(22), %r3 ! ddi_pathname
317: 25001204 setx DT_INTEGER[18], %r4 ! 0x20c
318: 07020404 add %r2, %r4, %r4
319: 25000e05 setx DT_INTEGER[14], %r5 ! 0x100
320: 3b030504 copys %r3, %r5, %r4
321: 23000002 ret %r2

More to come

Usability was a big topic at dtrace.conf a few months ago. Expect to see more contributions along this theme.
Recent Posts

April 17, 2024
January 13, 2024
December 29, 2023
February 12, 2017
December 18, 2016

Archives

Archives