Adam Leventhal's blog

Search
Close this search box.

Category: DTrace

It’s rare to get software right the first time. I’m not referring to bugs in implementation requiring narrow fixes, but rather places in a design that simply missed the mark. Even if getting it absolutely right the first time were possible, it would be prohibitively expensive (and time-consuming) so we make the best decisions we can, hammer it out, and then wait. Users of a product quickly become experts on its strengths and weaknesses for them.  Customers aren’t beta testers — again, I’m not talking about bugs — but rather they expose use cases you never anticipated, and present environments too convoluted to ever conceive at a whiteboard.

When I worked in the Fishworks group at Sun, we learned more about our market in the first three months after shipping 1.0 than we had in the 30 months we spent developing it. We found the product both struggling in unanticipated conditions, and being used to solve problems we could have never predicted.  Some of these we might have guessed earlier given more time, but some will never come to light until you ship. That you need to ship 1.0 before you can write 2.0 is a deeper notion than it appears.

I joined Delphix a couple of weeks before our formal launch at the DEMO conference. Since then, we’ve engaged in more proofs-of-contept (PoCs) and more customers have rolled us into use, and we’ve continued to learn of new use cases for Delphix Server, and found the places where we needed to rethink our assumptions. And we knew this would be the case — you can’t get it right the first time. Over the past several months, we in Delphix engineering have been writing the second version of the most critical components in our stack, incorporating the lessons learned with our customers. The team has enjoyed the opportunity to revisit design decisions with new information; it’s fun to feel like we’re not just getting it done, but getting it right.

When building 1.0, you make a mental list of the stuff you’d fix if only you had the time. In the next release, you figure out all the whizzy stuff you now can build on the stable foundation. We’re excited for the forthcoming 2.6 release — more so even for new ideas we found along the way that will be the basis for our future work. We’ve got a great team working on a great product. Check in on the Delphix blogs in the coming months for details on the 2.6 release and the other stuff we’ve got in the works.
I’ve been expecting this automated mail for a while now, but it was disheartening nonetheless:

List:       dtrace-discuss
Member:     bryan.cantrill@eng.sun.com
Action:     Subscription disabled.
Reason:     Excessive or fatal bounces.
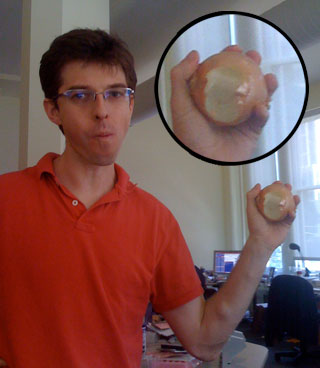
Bryan Cantrill, VP of Engineering at Joyent, earning $15.

As one of the moderators of the DTrace discussion list, I see people subscribe and unsubscribe. Bryan has, of course, left Oracle and joined Joyent to be their VP of engineering.

Bryan is a terrific engineer, and I count myself lucky to have worked with him for the past nine years first on DTrace and then on Fishworks. He taught me many things, but perhaps most important was his holistic view of engineering that encompasses all aspects of making a product successful including docs, pricing, talks, papers, and, of course, excellent code. Now Bryan is off to cut through the layers software that make up the cloud. Far from leaving the DTrace community, he’s going to take DTrace to new places and I look forward to seeing the fruits of his labor as he sinks his teeth into a new onion of abstractions.

… and, Robin, Bryan’s certainly a smart guy, but “the smart guy behind Dtrace [sic]”?? Just don’t refer to me and Mike as “the dumb guys behind DTrace” okay?

Back in January, I ranted about Apple’s ham-handed breakage in their DTrace port. After some injured feelings and teary embraces, Apple cleaned things up a bit, but some nagging issues remained as I wrote:

For the Apple folks: I’d argue that revealing the name of otherwise untraceable processes is no more transparent than what Activity Monitor provides — could I have that please?

It would be very un-Apple to — you know — communicate future development plans, but in 10.5.5, DTrace has seen another improvement. Previously when using DTrace to observe the system at large, iTunes and other paranoid apps would be hidden; now they’re showing up on the radar:

# dtrace -n 'profile-1999{ @[execname] = count(); }'
dtrace: description 'profile-1999' matched 1 probe
^C
loginwindow                                                       2
fseventsd                                                         3
kdcmond                                                           5
socketfilterfw                                                    5
distnoted                                                         7
mds                                                               8
dtrace                                                           12
punchin-helper                                                   12
Dock                                                             20
Mail                                                             25
Terminal                                                         26
SystemUIServer                                                   28
Finder                                                           42
Activity Monito                                                  49
pmTool                                                           67
WindowServer                                                    184
iTunes                                                         1482
kernel_task                                                    4030

And of course, you can use generally available probes to observe only those touchy apps with a predicate:

# dtrace -n 'syscall:::entry/execname == "iTunes"/{ @[probefunc] = count(); }'
dtrace: description 'syscall:::entry' matched 427 probes
^C
...
pwrite                                                           13
read                                                             13
stat64                                                           13
open_nocancel                                                    14
getuid                                                           22
getdirentries                                                    26
pread                                                            29
stat                                                             32
gettimeofday                                                     34
open                                                             36
close                                                            37
geteuid                                                          65
getattrlist                                                     199
munmap                                                          328
mmap                                                            338

Predictably, the details of iTunes are still obscured:

# dtrace -n pid42896:::entry
...
dtrace: error on enabled probe ID 225607 (ID 69364: pid42896:libSystem.B.dylib:pthread_mutex_unlock:entry):
invalid user access in action #1
dtrace: error on enabled probe ID 225546 (ID 69425: pid42896:libSystem.B.dylib:spin_lock:entry):
invalid user access in action #1
dtrace: 1005103 drops on CPU 1

… which is fine by me; I’ve got code of my own I should be investigating. While I’m loath to point it out, an astute reader and savvy DTrace user will note that Apple may have left the door open an inch wider than they had anticipated. Anyone care to post some D code that makes use of that inch? I’ll post an update as a comment in a week or two if no one sees it.

Update: There were some good ideas in the comments. Here’s the start of a script that can let you follow the flow of control of a thread in an “untraceable” process:

#!/usr/sbin/dtrace -s
#pragma D option quiet
pid$target:libSystem.B.dylib::entry,
pid$target:libSystem.B.dylib::return
{
trace("this program is already traceable\n");
exit(0);
}
ERROR
/self->level level > 40/
{
self->level = 0;
}
ERROR
{
this->p = ((dtrace_state_t *)arg0)->dts_ecbs[arg1 - 1]->dte_probe;
this->mod = this->p->dtpr_mod;
this->func = this->p->dtpr_func;
this->entry = ("entry" == stringof(this->p->dtpr_name));
}
ERROR
/this->entry/
{
printf("%*s-> %s:%s\n", self->level * 2, "",
stringof(this->mod), stringof(this->func));
self->level++;
}
ERROR
/!this->entry/
{
self->level--;
printf("%*slevel * 2, "",
stringof(this->mod), stringof(this->func));
}

Back in January, I posted about a problem with Apple’s port of DTrace to Mac OS X. The heart of the issue is that their port would silently drop data such that certain experiments would be quietly invalid. Unfortunately, most reactions seized on a headline paraphrasing a line of the post — albeit with the critical negation omitted (the subject and language were, perhaps, too baroque to expect the press to read every excruciating word). The good news is that Apple has (quietly) fixed the problem in Mac OS X 10.5.3.

One issue was that timer based probes wouldn’t fire if certain applications were actively executing (e.g. iTunes). This was evident both by counting periodic probe firings, and by the absence of certain applications when profiling. Apple chose to solve this problem by allowing the probes to fire while denying any inspection of untraceable processes (and generating a verbose error in that case). This script which should count 1000 firings per virtual CPU gave sporadic results on earlier revisions of Mac OS X 10.5:

profile-1000
{
        @ = count();
}
tick-1s
{
        printa(@);
        clear(@);
}

On 10.5.3, the output is exactly what one would expect on a 2-core CPU (1,000 executions per core):

1  22697                         :tick-1s
2000
1  22697                         :tick-1s
2000

On previous revisions, profiling to see what applications were spending the most time on CPU would silently omit certain applications. Now, while we can’t actually peer into those apps, we can infer the presence of stealthy apps when we encounter an error:

profile-199
{
        @[execname] = count();
}
ERROR
{
        @["=stealth app="] = count();
}

Running this DTrace script will generate a lot of errors as we try to evaluate the execname variable for secret applications, but at the end we’ll end up with a table like this:

Adium                                                             1
GrowlHelperApp                                                    1
iCal                                                              1
kdcmond                                                           1
loginwindow                                                       1
Mail                                                              2
Activity Monito                                                   3
ntpd                                                              3
pmTool                                                            6
mlb-nexdef-auto                                                  12
Terminal                                                         14
=stealth app=                                                    29
WindowServer                                                     34
kernel_task                                                     307
Safari                                                          571

A big thank you to Apple for making progress on this issue; the situation is now much improved and considerably more palatable. That said, there are a couple of problems. The first is squarely the fault of team DTrace: we should probably have a mode where errors aren’t printed particularly if the script is already handling them explicitly using an ERROR probe as in the script above. For the Apple folks: I’d argue that revealing the name of otherwise untraceable processes is no more transparent than what Activity Monitor provides — could I have that please? Also, I’m not sure if this has always been true, but the ustack() action doesn’t seem to work from the profile action so simple profiling scripts like this one produce a bunch of errors and no output:

profile-199
/execname == "Safari"/
{
        @[ustack()] = count();
}

But to reiterate: thank you thank you thank you, Steve, James, Tom, and the rest of the DTrace folks at Apple. It’s great to see these issues being addressed. The whole DTrace community appreciates it.

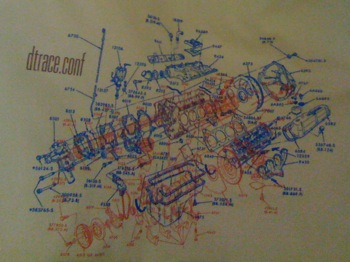
This originally was going to be a post-mortem on dtrace.conf, but so much time has passed, that I doubt it qualifies anymore. Back in March, we held the first ever DTrace (un)conference, and I hope I speak for all involved when I declare it a terrific success. And our t-shirts (logo pictured) were, frankly, bomb. Here are some fairly random impressions from the day:

Notes on the demographics at dtrace.conf: Macs were the most prevalent laptops by quite a wide margin, and a ton of demos were done under VMware for the Mac. There were a handful of dvorak users who far outnumbered the Esperanto speakers (there were none) despite apparently similarly rationales. There were, by a wide margin, more live demonstrations that I’d seen during a day of technical talks; there were probably fewer individual slides than demos — exactly what we had in mind.

My favorite session brought the authors of the three DTrace ports to the front of the room to talk about porting, and answer questions (mostly from the DTrace team). I was excited that they agreed to work together on a wiki and on a DTrace porting project. Both would be great for new ports and for building a repository that could integrate all the ports into a single repository. I just have to see if I can get them to follow through now several weeks removed from the DTrace love-in…

Also particularly interesting were a demonstration of a DTrace-enabled Adobe Air prototype and the very clever mechanism behind the Java group’s plan for native Java static probes (JSDT). Essentially, they’re using the same technique as normal USDT, but dynamically generating the tracing description structures and sending them down to the kernel (slick).

The most interesting discussion resulted from Keith’s presentation of vprobes — a DTrace… um… inspired facility in VMware. While it is necessary to place a unified tracing mechanism at the lowest level of software abstraction (in DTrace’s case, the kernel), it may also make sense to embed collaborating tracing frameworks at other levels of the stack. For example, the JVM could include a micro-DTrace which communicated with DTrace in the kernel as needed. This would both improve enabled performance (not a primary focus of DTrace), and allow for better domain-specific instrumentation and expression. I’ll be interested to see how vprobes executes on this idea.

Requests from the DTrace community:

  • more providers ala the recent nfs and proposed ip providers
  • consistency between providers (kudos to those sending their providers to the DTrace discussion list for review)
  • better compatibility with the ports — several people observed that while they love the port to Leopard, Apple’s spurious exclusion of the -G option created tricky conflicts

Ben was kind enough to video the entire day. We should have the footage publicly available in about a week. Thanks to all who participated; several recent projects have already gotten me excited for dtrace.conf(09).

It was a good run, but Jarod and I didn’t make the cut for JavaOne this year…

2005

In 2005, Jarod came up with what he described as a jacked up way to use DTrace to get inside Java. This became the basis of the Java provider (first dvm for the 1.4.2 and 1.5 JVMs and now the hotspot provider for Java 6). That year, I got to stand up on stage at the keynote with John Loiacono and present DTrace for Java for the first time (to 10,000 people — I was nervous). John was then the EVP of software at Sun. Shortly after that, he parlayed our keynote success into a sweet gig at Adobe (I was considered for the job, but ultimately rejected, they said, because their door frames couldn’t accommodate my fro — legal action is pending).

That year we also started the DTrace challenge. The premise was that if we chained up Jarod in the exhibition hall, developers could bring him their applications and he could use DTrace to find a performance win — or he’d fork over a free iPod. In three years Jarod has given out one iPod and that one deserves a Bondsian asterisk.

After the excitement of the keynote, and the frenetic pace of the exhibition hall (and a haircut), Jarod and I anticipated at least fair interest in our talk, but we expected the numbers to be down a bit because we were presenting in the afternoon on the last day of the conference. We got to the room 15 minutes early to set up, skirting what we thought must have been the line for lunch, or free beer, or something, but turned out to be the line for our talk. Damn. It turns out that in addition to the 1,000 in the room, there was an overflow room with another 500-1,000 people. That first DTrace for Java talk had only the most basic features like tracing method entry and return, memory allocation, and Java stack backtraces — but we already knew we were off to a good start.

2006

No keynote, but the DTrace challenge was on again and our talk reprised its primo slot on the last day of the conference after lunch (yes, that’s sarcasm). That year the Java group took the step of including DTrace support in the JVM itself. It was also possible to dynamically turn instrumentation of the JVM off and on as opposed to the start-time option of the year before. In addition to our talk, there was a DTrace hands-on lab that was quite popular and got people some DTrace experience after watching what it can do in the hands of someone like Jarod.

2007

The DTrace talk in 2007 (again, last day of the conference after lunch) was actually one of my favorite demos I’ve given because I had never seen the technology we were presenting before. Shortly before JavaOne started, Lev Serebryakov from the Java group had built a way of embedding static probes in a Java program. While this isn’t required to trace Java code, it does mean that developers can expose the higher level semantics of their programs to users and developers through DTrace. Jarod hacked up an example in his hotel room about 20 minutes before we presented, and amazingly it all went off without a hitch. How money is that?

JSDT — as the Java Statically Defined Tracing is called — is in development for the next version of the JVM, and is the next step for DTrace support of dynamic languages. Java was the first dynamic language that we first considered for use with DTrace, and it’s quite a tough environment to support due to the incredible sophistication of the JVM. That support has lead the way for other dynamic languages such as Ruby, Perl, and Python which all now have built-in DTrace providers.

2008

For DTrace and Java, this is not the end. It is not even the beginning of the end. Jarod and I are out, but Jon, Simon, Angelo, Raghavan, Amit, and others are in. At JavaOne 2008 next month there will be a talk, a BOF, and a hands-on lab about DTrace for Java and it’s not even all Java: there’s some php and JavaScript mixed in and both also have their own DTrace providers. I’ve enjoyed speaking at JavaOne these past three years, and while it’s good to pass the torch, I’ll miss doing it again this year. If I have the time, and can get past security I’ll try to sneak into Jon and Simon’s talk — though it will be a departure from tradition for a DTrace talk to fall on a day other than the last.

Recent Posts

April 17, 2024
January 13, 2024
December 29, 2023
February 12, 2017
December 18, 2016

Archives

Archives