Search
Close this search box.

In previous posts I discussed the problems with the legacy ZFS write throttle that cause degraded performance and wildly variable latencies. I then presented the new OpenZFS write throttle and I/O scheduler that Matt Ahrens and I designed. In addition to solving several problems in ZFS, the new approach was designed to be easy to reason about, measure, and adjust. In this post I’ll cover performance analysis and tuning — using DTrace of course. These details are intended for those using OpenZFS and trying to optimize performance — if you have only a casual interest in ZFS consider yourself warned!

Buffering dirty data

OpenZFS limits the amount of dirty data on the system according to the tunable zfs_dirty_data_max. It’s default value is 10% of memory up to 4GB. The tradeoffs are pretty simple:

Lower Higher
Less memory reserved for use by OpenZFS More memory reserved for use by OpenZFS
Able to absorb less workload variation before throttling Able to absorb more workload variation before throttling
Less data in each transaction group More data in each transaction group
Less time spent syncing out each transaction group More time spent syncing out each transaction group
More metadata written due to less amortization Less metadata written due to more amortization


Most workloads contain variability. Think of the dirty data as a buffer for that variability. Let’s say the LUNs assigned to your OpenZFS storage pool are able to sustain 100MB/s in aggregate. If a workload consistently writes at 100MB/s then only a very small buffer would be required. If instead the workload oscillates between 200MB/s and 0MB/s for 10 seconds each, then a small buffer would limit performance. A buffer of 800MB would be large enough to absorb the full 20 second cycle over which the average is 100MB/s. A buffer of only 200MB would cause OpenZFS to start to throttle writes — inserting artificial delays — after less than 2 seconds during which the LUNs could flush 200MB of dirty data while the client tried to generate 400MB.

Track the amount of outstanding dirty data within your storage pool to know which way to adjust zfs_dirty_data_max:

txg-syncing
{
        this->dp = (dsl_pool_t *)arg0;
}

txg-syncing
/this->dp->dp_spa->spa_name == $$1/
{
        printf("%4dMB of %4dMB used", this->dp->dp_dirty_total / 1024 / 1024,
            `zfs_dirty_data_max / 1024 / 1024);
}

# dtrace -s dirty.d pool
dtrace: script 'dirty.d' matched 2 probes
CPU ID FUNCTION:NAME
11 8730 txg_sync_thread:txg-syncing 966MB of 4096MB used
0 8730 txg_sync_thread:txg-syncing 774MB of 4096MB used
10 8730 txg_sync_thread:txg-syncing 954MB of 4096MB used
0 8730 txg_sync_thread:txg-syncing 888MB of 4096MB used
0 8730 txg_sync_thread:txg-syncing 858MB of 4096MB used

The write throttle kicks in once the amount of dirty data exceeds zfs_delay_min_dirty_percent of the limit (60% by default). If the the amount of dirty data fluctuates above and below that threshold, it might be possible to avoid throttling by increasing the size of the buffer. If the metric stays low, you may reduce zfs_dirty_data_max. Weigh this tuning against other uses of memory on the system (a larger value means that there’s less memory for applications or the OpenZFS ARC for example).

A larger buffer also means that flushing a transaction group will take longer. This is relevant for certain OpenZFS administrative operations (sync tasks) that occur when a transaction group is committed to stable storage such as creating or cloning a new dataset. If the interactive latency of these commands is important, consider how long it would take to flush zfs_dirty_data_max bytes to disk. You can measure the time to sync transaction groups (recall, there are up to three active at any given time) like this:

txg-syncing
/((dsl_pool_t *)arg0)->dp_spa->spa_name == $$1/
{
        start = timestamp;
}

txg-synced
/start && ((dsl_pool_t *)arg0)->dp_spa->spa_name == $$1/
{
        this->d = timestamp - start;
        printf("sync took %d.%02d seconds", this->d / 1000000000,
            this->d / 10000000 % 100);
}

# dtrace -s duration.d pool
dtrace: script 'duration.d' matched 2 probes
CPU ID FUNCTION:NAME
5 8729 txg_sync_thread:txg-synced sync took 5.86 seconds
2 8729 txg_sync_thread:txg-synced sync took 6.85 seconds
11 8729 txg_sync_thread:txg-synced sync took 6.25 seconds
1 8729 txg_sync_thread:txg-synced sync took 6.32 seconds
11 8729 txg_sync_thread:txg-synced sync took 7.20 seconds
1 8729 txg_sync_thread:txg-synced sync took 5.14 seconds

Note that the value of zfs_dirty_data_max is relevant when sizing a separate intent log device (SLOG). zfs_dirty_data_max puts a hard limit on the amount of data in memory that has yet been written to the main pool; at most, that much data is active on the SLOG at any given time. This is why small, fast devices such as the DDRDrive make for great log devices. As an aside, consider the ostensible upgrade that Oracle brought to the ZFS Storage Appliance a few years ago replacing the 18GB “Logzilla” with a 73GB upgrade.

I/O scheduler

Where ZFS had a single IO queue for all IO types, OpenZFS has five IO queues for each of the different IO types: sync reads (for normal, demand reads), async reads (issued from the prefetcher), sync writes (to the intent log), async writes (bulk writes of dirty data), and scrub (scrub and resilver operations). Note that bulk dirty data described above are scheduled in the async write queue. See vdev_queue.c for the related tunables:

uint32_t zfs_vdev_sync_read_min_active = 10;
uint32_t zfs_vdev_sync_read_max_active = 10;
uint32_t zfs_vdev_sync_write_min_active = 10;
uint32_t zfs_vdev_sync_write_max_active = 10;
uint32_t zfs_vdev_async_read_min_active = 1;
uint32_t zfs_vdev_async_read_max_active = 3;
uint32_t zfs_vdev_async_write_min_active = 1;
uint32_t zfs_vdev_async_write_max_active = 10;
uint32_t zfs_vdev_scrub_min_active = 1;
uint32_t zfs_vdev_scrub_max_active = 2;

Each of these queues has tunable values for the min and max number of outstanding operations of the given type that can be issued to a leaf vdev (LUN). The tunable zfs_vdev_max_active limits the number of IOs issued to a single vdev. If its value is less than the sum of the zfs_vdev_*_max_active tunables, then the minimums come into play. The minimum number of each queue will be scheduled and the remainder of zfs_vdev_max_active is issued from the queues in priority order.

At a high level, the appropriate values for these tunables will be specific to your LUNs. Higher maximums lead to higher throughput with potentially higher latency. On some devices such as storage arrays with distinct hardware for reads and writes, some of the queues can be thought of as independent; on other devices such as traditional HDDs, reads and writes will likely impact each other.

A simple way to tune these values is to monitor I/O throughput and latency under load. Increase values by 20-100% until you find a point where throughput no longer increases, but latency is acceptable.

#pragma D option quiet

BEGIN
{
        start = timestamp;
}

io:::start
{
        ts[args[0]->b_edev, args[0]->b_lblkno] = timestamp;
}

io:::done
/ts[args[0]->b_edev, args[0]->b_lblkno]/
{
        this->delta = (timestamp - ts[args[0]->b_edev, args[0]->b_lblkno]) / 1000;
        this->name = (args[0]->b_flags & (B_READ | B_WRITE)) == B_READ ?
            "read " : "write ";

        @q[this->name] = quantize(this->delta);
        @a[this->name] = avg(this->delta);
        @v[this->name] = stddev(this->delta);
        @i[this->name] = count();
        @b[this->name] = sum(args[0]->b_bcount);

        ts[args[0]->b_edev, args[0]->b_lblkno] = 0;
}

END
{
        printa(@q);

        normalize(@i, (timestamp - start) / 1000000000);
        normalize(@b, (timestamp - start) / 1000000000 * 1024);

        printf("%-30s %11s %11s %11s %11s\n", "", "avg latency", "stddev",
            "iops", "throughput");
        printa("%-30s %@9uus %@9uus %@9u/s %@8uk/s\n", @a, @v, @i, @b);
}

# dtrace -s rw.d -c 'sleep 60'

  read
           value  ------------- Distribution ------------- count
              32 |                                         0
              64 |                                         23
             128 |@                                        655
             256 |@@@@                                     1638
             512 |@@                                       743
            1024 |@                                        380
            2048 |@@@                                      1341
            4096 |@@@@@@@@@@@@                             5295
            8192 |@@@@@@@@@@@                              5033
           16384 |@@@                                      1297
           32768 |@@                                       684
           65536 |@                                        400
          131072 |                                         225
          262144 |                                         206
          524288 |                                         127
         1048576 |                                         19
         2097152 |                                         0

  write
           value  ------------- Distribution ------------- count
              32 |                                         0
              64 |                                         47
             128 |                                         469
             256 |                                         591
             512 |                                         327
            1024 |                                         924
            2048 |@                                        6734
            4096 |@@@@@@@                                  43416
            8192 |@@@@@@@@@@@@@@@@@                        102013
           16384 |@@@@@@@@@@                               60992
           32768 |@@@                                      20312
           65536 |@                                        6789
          131072 |                                         860
          262144 |                                         208
          524288 |                                         153
         1048576 |                                         36
         2097152 |                                         0

                               avg latency      stddev        iops  throughput
write                              19442us     32468us      4064/s   261889k/s
read                               23733us     88206us       301/s    13113k/s

Async writes

Dirty data governed by zfs_dirty_data_max is written to disk via async writes. The I/O scheduler treats async writes a little differently than other operations. The number of concurrent async writes scheduled depends on the amount of dirty data on the system. Recall that there is a fixed (but tunable) limit of dirty data in memory. With a small amount of dirty data, the scheduler will only schedule a single operation (zfs_vdev_async_write_min); the idea is to preserve low latency of synchronous operations when there isn’t much write load on the system. As the amount of dirty data increases, the scheduler will push the LUNs harder to flush it out by issuing more concurrent operations.

The old behavior was to schedule a fixed number of operations regardless of the load. This meant that the latency of synchronous operations could fluctuate significantly. While writing out dirty data ZFS would slam the LUNs with writes, contending with synchronous operations and increasing their latency. After the syncing transaction group had completed, there would be a period of relatively low async write activity during which synchronous operations would complete more quickly. This phenomenon was known as “picket fencing” due to the square wave pattern of latency over time. The new OpenZFS I/O scheduler is optimized for consistency.

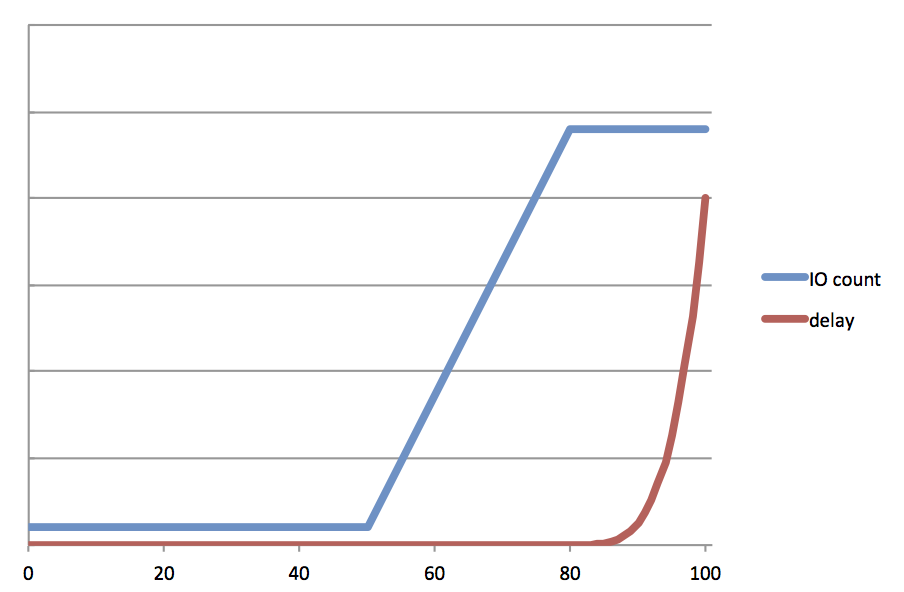
In addition to tuning the minimum and maximum number of concurrent operations sent to the device, there are two other tunables related to asynchronous writes: zfs_vdev_async_write_active_min_dirty_percent and zfs_vdev_async_write_active_max_dirty_percent. Along with the min and max operation counts (zfs_vdev_async_write_min_active and zfs_vdev_aysync_write_max_active), these four tunables define a piece-wise linear function that determines the number of operations scheduled as depicted in this lovely ASCII art graph excerpted from the comments:

 * The number of concurrent operations issued for the async write I/O class
 * follows a piece-wise linear function defined by a few adjustable points.
 *
 *        |                   o---------| <-- zfs_vdev_async_write_max_active
 *   ^    |                  /^         |
 *   |    |                 / |         |
 * active |                /  |         |
 *  I/O   |               /   |         |
 * count  |              /    |         |
 *        |             /     |         |
 *        |------------o      |         | <-- zfs_vdev_async_write_min_active
 *       0|____________^______|_________|
 *        0%           |      |       100% of zfs_dirty_data_max
 *                     |      |
 *                     |      `-- zfs_vdev_async_write_active_max_dirty_percent
 *                     `--------- zfs_vdev_async_write_active_min_dirty_percent

In a relatively steady state we’d like to see the amount of outstanding dirty data stay in a narrow band between the min and max percentages, by default 30% and 60% respectively.

Tune zfs_vdev_async_write_max_active as described above to maximize throughput without hurting latency. The only reason to increase zfs_vdev_async_write_min_active is if additional writes have little to no impact on latency. While this could be used to make sure data reaches disk sooner, an alternative approach is to decrease zfs_vdev_async_write_active_min_dirty_percent thereby starting to flush data despite less dirty data accumulating.

To tune the min and max percentages, watch both latency and the number of scheduled async write operations. If the operation count fluctuates wildly and impacts latency, you may want to flatten the slope by decreasing the min and/or increasing the max (note below that you will likely want to increase zfs_delay_min_dirty_percent if you increase zfs_vdev_async_write_active_max_dirty_percent — see below).

#pragma D option aggpack
#pragma D option quiet

fbt::vdev_queue_max_async_writes:entry
{
        self->spa = args[0];
}
fbt::vdev_queue_max_async_writes:return
/self->spa && self->spa->spa_name == $$1/
{
        @ = lquantize(args[1], 0, 30, 1);
}

tick-1s
{
        printa(@);
        clear(@);
}

fbt::vdev_queue_max_async_writes:return
/self->spa/
{
        self->spa = 0;
}

# dtrace -s q.d dcenter

min .--------------------------------. max | count
< 0 : ▃▆ : >= 30 | 23279

min .--------------------------------. max | count
< 0 : █ : >= 30 | 18453

min .--------------------------------. max | count
< 0 : █ : >= 30 | 27741

min .--------------------------------. max | count
< 0 : █ : >= 30 | 3455

min .--------------------------------. max | count
< 0 : : >= 30 | 0

Write delay

In situations where LUNs cannot keep up with the incoming write rate, OpenZFS artificially delays writes to ensure consistent latency (see the previous post in this series). Until a certain amount of dirty data accumulates there is no delay. When enough dirty data accumulates OpenZFS gradually increases the delay. By delaying writes OpenZFS effectively pushes back on the client to limit the rate of writes by forcing artificially higher latency. There are two tunables that pertain to delay: how much dirty data there needs to be before the delay kicks in, and the factor by which that delay increases as the amount of outstanding dirty data increases.

The tunable zfs_delay_min_dirty_percent determines when OpenZFS starts delaying writes. The default is 60%; note that we don’t start delaying client writes until the IO scheduler is pushing out data as fast as it can (zfs_vdev_async_write_active_max_dirty_percent also defaults to 60%).

The other relevant tunable is zfs_delay_scale is really the only magic number here. It roughly corresponds to the inverse of the maximum number of operations per second (denominated in nanoseconds), and is used as a scaling factor.

Delaying writes is an aggressive step to ensure consistent latency. It is required if the client really is pushing more data than the system can handle, but unnecessarily delaying writes degrades overall throughput. There are two goals to tuning delay: reduce or remove unnecessary delay, and ensure consistent delays when needed.

First check to see how often writes are delayed. This simple DTrace one-liner does the trick:

# dtrace -n fbt::dsl_pool_need_dirty_delay:return'{ @[args[1] == 0 ? "no delay" : "delay"] = count(); }'

If a relatively small percentage of writes are delayed, increasing the amount of dirty data allowed (zfs_dirty_data_max) or even pushing out the point at which delays start (zfs_delay_min_dirty_percent). When increasing zfs_dirty_data_max consider the other users of DRAM on the system, and also note that a small amount of small delays does not impact performance significantly.

If many writes are being delayed, the client really is trying to push data faster than the LUNs can handle. In that case, check for consistent latency, again, with a DTrace one-liner:

# dtrace -n delay-mintime'{ @ = quantize(arg2); }'

With high variance or if many write operations are being delayed for the maximum zfs_delay_max_ns (100ms by default) then try increasing zfs_delay_scale by a factor of 2 or more, or try delaying earlier by reducing zfs_delay_min_dirty_percent (remember to also reduce zfs_vdev_async_write_active_max_dirty_percent).

Summing up

Our experience at Delphix tuning the new write throttle has been so much better than in the old ZFS world: each tunable has a clear and comprehensible purpose, their relationships are well-defined, and the issues in tension pulling values up or down are both easy to understand and — most importantly — easy to measure. I hope that this tuning guide helps others trying to get the most out of their OpenZFS systems whether on Linux, FreeBSD, Mac OS X, illumos — not to mention the support engineers for the many products that incorporate OpenZFS into a larger solution.

I started my blog June 17, 2004, tempted by the opportunity of Sun’s blogging policy, and cajoled by Bryan Cantrill’s presentation to the Solaris Kernel Team “Guerrilla Marketing” (net: Sun has forgotten about Solaris so let’s get the word out). I was a skeptical blogger. I even resisted the contraction “blog”, insisting on calling it “Adam Leventhal’s Weblog” as if linguistic purity would somehow elevate me above the vulgar blogspotter opining over toothpaste brands. (That linguistic purity did not, however, carry over into my early writing — my goodness it was painful to open that unearthed time capsule.)

A little about my blog. When I started blogging I was worried that I’d need to post frequently to build a readership. That was never going to happen. Fortunately aggregators (RSS feeds then; Twitter now) and web searches are far more relevant. My blog is narrow. There’s a lot about DTrace (a technology I helped develop), plenty in the last four years about Delphix (my employer), and samplings of flash memory, Galois fields, RAID, and musings on software and startups. The cumulative intersection consists of a single person. But — and this is hard to fathom — I’ve hosted a few hundred thousand unique visitors over the years. Aggregators pick up posts soon after posting; web searches drive traffic for years even on esoteric topics.

Ten years and 172 posts later, I wanted to see what lessons I could discern. So I turned to Google Analytics.

Most popular

3. I was surprised to see that my posts on double- and triple-parity RAID for ZFS have been among the most consistently read over the years since posting in 2006 and 2009 respectively. The former is almost exclusively an explanation of abstract algebra that I was taught in 2000, applied in 2006, and didn’t understand properly until 2009 — when wrote the post. The latter is catharsis from discovering errors in the published basis for our RAID implementation. I apparently considered it a personal affront.

2. When Oracle announced their DTrace port to Linux in 2011 a pair of posts broke the news and then deflated expectations — another personal affront — as the Oracle Linux efforts fell short of expectations (and continue to today). I had learned the lesson earlier that DTrace + a more popular operating system always garnered more interest.

1. In 2008 I posted about a defect in Apple’s DTrace implementation that was the result of it’s paranoid DRM protection. This was my perfect storm of blogging popularity: DTrace, more popular OS (Max OS X!), Apple-bashing, and DRM! The story was snapped up by Slashdot (Reddit of the mid-2000s) as “Apple Crippled Its DTrace Port” and by The Register’s Ashlee Vance (The Register’s Chris Mellor of the mid-2000s) as “Apple cripples Sun’s open source jewel: Hollywood love inspires DTrace bomb.” It’s safe to say that I’m not going to see another week with 49,312 unique visitors any time soon. And to be clear I’m deeply grateful to that original DTrace team at Apple — the subject of a different post.

And many more…

Some favorites of mine and of readers (views, time on site, and tweets) over the years:

2004 Solaris 10 11-20. Here was a fun one. Solaris 10 was a great release. Any of the top ten features would have been the headliner in a previous release so I did a series on some of the lesser features that deserved to make the marquee. (If anyone would like to fill in number 14, dynamic System V IPC, I’d welcome the submission.)

2004 Inside nohup -p. The nohup command had remained virtual untouched since being developed at Bell Labs by the late Joseph Ossanna (described as “a peach and a ramrod”). I enjoyed adding some 21st century magic, and suffocating the reader with the details.

2005 DTrace is open. It truly was an honor to have DTrace be the first open source component of Solaris. That I took the opportunity to descend to crush depth was a testament to the pride I took in that code. (tsj and Kamen, I’m seeing your comments now for the first time and will respond shortly.)

2005 Sanity and FUD. This one is honestly adorable. Only a naive believer could have been such a passionate defender of what would become Oracle Solaris.

2005 DTrace in the JavaOne Keynote. It was a trip to present to over 10,000 people at Moscone. I still haven’t brought myself to watch the video. Presentation tip: to get comfortable speaking to an audience of size N simply speak to an audience of size 10N.

2005 The mysteries of _init. I geeked out about some of the voodoo within the linker. And I’m glad I did because a few weeks ago that very post solved a problem for one of my colleagues. I found myself reading the post with fascination (of course having forgotten it completely).

2008 Hybrid Storage Pools in CACM. In one of my first published articles, I discussed how we were using flash memory — a niche product at the time — as a component in enterprise storage. Now, of course, flash has always been the obvious future of storage; no one had yet realized that at the time.

2012 Hardware Engineer. At Fishworks (building the ZFS Storage Appliance at Sun) I got the nickname “Adam Leventhal, Hardware Engineer” for my preternatural ability to fit round pegs in square holes; this post catalogued some of those experiments.

2013 The Holistic Engineer. My thoughts on what constitutes a great engineer; this has become a frequently referenced guidepost within Delphix engineering.

2013 Delphix plus three years. Obviously I enjoy anniversaries. This was both a fun one to plan and write, and the type of advice I wish I had taken to heart years ago.

You said something about lessons?

The popularity of those posts about DTrace for Mac OS X and Linux had suggested to me that controversy is more interesting than data. While that may be true, I think the real driver was news. With most tech publications regurgitating press releases, people appreciate real investigation and real analysis. (Though Google Analytics does show that popularity is inversely proportional to time on site i.e. thorough reading.)

If you want people to read (and understand) your posts, run a draft through one of those online grade-level calculators. Don’t be proud of writing at a 12th grade level; rewrite until 6th graders can understand. For complex subjects that may be difficult, but edit for clarity. Simpler is better.

Everyone needs an editor. I find accepting feedback to be incredibly difficult — painful — but it yields a better result. Find someone you trust to provide the right kind of feedback.

Early on blogging seemed hokey. Today it still can feel hokey — dispatches that feel directed at no one in particular. But I’d encourage just about any engineer to start a blog. It forces you to organize your ideas in a different and useful way, and it connects you with the broader community of users, developers, employees, and customers. For the past ten years I’ve walked into many customers who now start the conversation aware of topics and technology I care about.

Finally, reading those old blog posts was painful. I got (slightly) better the only way I knew how: repetition. Get the first 100 posts out of the way so that you can move on to the next 100. Don’t worry about readership. Don’t worry about popularity. Interesting content will find an audience, but think about your reader. Just start writing.

Delphix custsignsomers include top companies across a wide range of industries, most of them executing around the clock. Should a problem arise they require support from Delphix around the clock as well. To serve our customers’ needs we’ve drawn from industry best-practices while recently mixing in an unconventional approach to providing the best possible customer service regardless of when a customer encounters a problem.

There are three common approaches to support: outsourcing, shifts, and “follow the sun”. Outsourcing is economical but quality and consistency suffer especially for difficult cases. Asking outstanding engineers to cover undesirable shifts is unappealing. An on-call rotation (shifts “lite”) may be more tolerable but can be inadequate — and stressful — in a crisis. Hiring a geographically dispersed team — whose natural work day “follows the sun” — provides a more durable solution but has its own challenges. Interviewing is tough. Training is tougher. And maintaining education and consistency across the globe is nearly impossible.

Live communication simplifies training. New support engineers learn faster with live — ideally local — mentors, experts on a wide range of relevant technologies. The team is more able to stay current on the product and tools by working collaboratively. In a traditional “follow the sun” model, the first support engineer in a new locale is doubly disadvantaged — the bulk of the team is unavailable during the work day, and there’s no local experienced team for collaboration.

At Delphix, we don’t outsource our support engineering. We do hire around the globe, and we do have an on-call schedule. We’ve also drawn inspiration from an innovative approach employed by Moneypenny, a UK-based call center. Moneypenny had resisted extending their service to off-hours because they didn’t want to incur the detrimental effects of shift work to employee’s health and attitude. They didn’t want to outsource work because they were afraid customer satisfaction would suffer. Instead they took the novel step of opening an Auckland office — 12 hours offset — and sending employees for 4-6 months on a voluntary basis.

I was idly listening to NPR in the car when I heard the BBC report on Moneypenny. Their customers and employees raved about the approach. It was such a simple and elegant solution to the problem of around the clock support; I pulled over to consider the implications for Delphix Support. The cost of sending a support engineer to a remote destination would be paltry compared with the negative consequences associated with other approaches to support: weak hires, inconsistent methodologies, insufficient mentorship, not to mention underserved, angry, or lost customers. And the benefits to customers and the rest of the team would again far exceed the expense.

We call it the Delphix Support “term abroad.” As with a term abroad in school, it’s an opportunity for one of our experienced support engineers to work in a foreign locale. Delphix provides lodging in a sufficiently remote timezone with the expectation of a fairly normal work schedule. As with Moneypenny, that means that Delphix is able to provide the same high level of technical support at all times of day. In addition, that temporarily remote engineer can help to build a local team by recruiting, interviewing, and mentoring.

David — the longest tenured member of the Delphix support team — recently returned from a term abroad to the UK where he joined Scott, a recent hire and UK native. Scott spent a month working with David and others at our Menlo Park headquarters. Then David joined Scott in the UK to continue his mentorship and training. Both worked cases that would have normally paged the on-call engineer. A day after arriving in the UK, in fact, David and Scott handled two cases that would have otherwise woken up an engineer based in the US.

Early results give us confidence that the term abroad is going to be a powerful and complementary tool. Delphix provides the same high quality support at all hours, while expanding globally and increasing the satisfaction of the team. And it makes Delphix Support an even more attractive place to work for those who want to opt in to a little global adventure.

Data breaches make headlines at a regular cadence. Each is a surprise, but they are not, as a whole, surprising. While the extensive and sophisticated Target breach stuck in the headlines, a significant breach at three South Korean credit card companies happened around the same time. The theft of personal information for 20m subscribers didn’t have near the level of sophistication. Developers and contractors were simply given copies of production databases filled with personal information that they shouldn’t have been able to access.

When talking to Delphix customers and prospects, those that handle personal or sensitive information (typically financial services or heath care) inevitably ask how Delphix can help with masking. Turning the question around, asking how they mask data today sucks the air out of the room. Some deflect, talking about relevant requirements and regulations; others, pontificate obliquely about solutions they’ve bought; no one unabashedly claims to be fully implemented and fully compliant.

Data masking is hard to deploy consistently. I hear it from (honest) customers, and from data masking vendors. The striking attribute of the South Korean breach was that the Economist and other non-technical news sources called out unmasked data as the root cause:

“In 2012 a law was passed requiring the encryption of most companies’ databases, yet the filched data were not encoded. The contractor should never have been given access to customer records, he says; dummy data would have sufficed.”

These were non-production database copies, used for development and testing. There was no need for employees or contractors to interact with sensitive data. Indeed, those companies have a legal obligation not to keep production data in their development environments. All three credit card companies, and the credit bureau are customers of vendors that provide masking solutions. The contractor who loaded data for 20m individuals onto a USB stick didn’t need the real data, and should never been granted access. As with the customers I talk to, data masking surely proved too difficult to roll out in a manner that was secure and didn’t slow development, so it was relegated to shelfware.

Delphix fully automates the creation of non-production environments. It integrates with masking tools from Axis, Informatica, IBM, and others to ensure that every one of those environments is masked as a matter of mechanism rather than a manual process. What is the cost of unimplemented data masking? Obviously there are the fines and negative press, the lawsuits, and the endless mea culpas. At these credit card companies though literally dozens of executives resigned for failing to secure data, from all three CEOs on down. And in all likelihood, they had data masking solutions on the shelf, cast aside as too hard to implement.

In my last blog post, I wrote about the ZFS write throttle, and how we saw it lead to pathological latency variability on customer systems. Matt Ahrens, the co-founder of ZFS, and I set about to fix it in OpenZFS. While the solution we came to may seem obvious, we arrived at it only through a bit of wandering in a wide open solution space.

The ZFS write throttle was fundamentally flawed — the data indelibly supported this diagnosis. The cure was far less clear. The core problem involved the actual throttling mechanism, allowing many fast writes while stalling some writes nearly without bound, with some artificially delayed writes ostensibly to soften the landing. Further, the mechanism relied on an accurate calculation of the backend throughput — a problem in itself, but one we’ll set aside for the moment.

On a frictionless surface in a vacuum…

Even in the most rigorously contrived, predictable cases, the old write throttle would yield high variance in the latency of writes. Consider a backend that can handle an unwavering 100MB/s (or 1GB/s or 10GB/s — pick your number). For a client with 10 threads executing 8KB async writes (again to keep it simple) to hit 100MB/s, the average latency would be around 780µs — not unreasonable.

Here’s how that scenario would play out with the old write throttle assuming full quiesced and syncing transaction groups (you may want to refer to my last blog post for a refresher on the mechanism and some of the numbers). With a target of 5 seconds to write out its contents, the currently open transaction group would be limited to 500MB. Recall that after 7/8ths of the limit is consumed, the old write throttle starts inserting a 10ms delay, so the first 437.5MB would come sailing in, say, with an average latency of 780µs, but then the remaining writes would average at least 10ms (scheduling delay could drive this even higher). With this artificially steady rate, the delay would occur 7/8ths of the way into our 5 second window, with 1/8th of the total remaining. So with 5/8ths of a second left, and an average latency of 10ms, the client would be able to write only and additional 500KB worth of data. More simply: data would flow at 100MB/s most of the time, and at less than 1MB/s the rest.

In this example the system inserted far too much delay — indeed, no delay was needed. In another scenario it could just have easily inserted too little.

Consider a case where we would require writers to be throttled. This time, let’s say the client has 1000 threads, and — since it’s now relevant — let’s say we’re limited to the optimistic 10GbE speed of 1GB/s. In this case the client would hit the 7/8ths in less than a second. 1000 threads writing 8KB every 10ms still push data at 800MB/s so we’d hit the hard limit just a fraction of a second later. With the quota exhausted, all 1000 threads would then block for about 4 seconds. A backend that can do 100MB/s x 5 seconds = 500MB = 64,000 x 8KB; the latency of those 64,000 writes breaks down like this: 55000 super fast, 8000 at 10ms, and 1000 at 4 seconds. Note that the throughput would be only slightly higher than in the previous example; the average latency would be approximately 1000 times higher which is optimal and expected.

In this example we delayed way too little, and paid the price with enormous 4 second outliers.

How to throttle

Consistency is more important than the average. The VP of Systems at a major retailer recently told me that he’d take almost always take a higher average for lower variance. Our goal for OpenZFS was to have consistent latency without lowering the average (if we could improve the average, hey so much the better). Given the total amount of work, there is a certain amount of delay we’d need to insert. The ZFS write throttle does so unequally. Our job was to delay all writes a little bit rather than some a lot.

One of our first ideas was to delay according to measured throughput. As with the example above, let’s say that the measured throughput of the backend was 100MB/s. If the transaction group had been open for 500ms, and we had accumulated 55MB so far, the next write would be delayed for 50ms, enough time to reduce the average to 100MB/s.

Think of it like a diagonal line on a graph from 0MB at time zero to the maximum size (say, 500MB) at the end of the transaction group (say, 5s). As the accumulated data pokes above that line, subsequent writes would be delayed accordingly. If we hit the data limit per transaction group then writes would be delayed as before, but it should be less likely as long as we’ve measured the backend throughput accurately.

There were two problems with this solution. First, calculating the backend throughput isn’t possible to do accurately. Performance can fluctuate significantly due to the location of writes, intervening synchronous activity (e.g. reads), or even other workloads on a multitenant storage array. But even if we could calculate it correctly, ZFS can’t spend all its time writing user data; some time must be devoted to writing metadata and doing other housekeeping.

Size doesn’t matter

Erasing the whiteboard, we added one constraint and loosened another: don’t rely an estimation of backend throughput, and don’t worry too much about transaction group duration.

Rather than capping transaction groups to a particular size, we would limit the amount of system memory that could be dirty (modified) at any given time. As memory filled past a certain point we would start to delay writes proportionally.

OpenZFS didn’t have a mechanism to track the outstanding dirty data. Adding it was non-trivial as it required communication across the logical (DMU) and physical (SPA) boundaries to smoothly retire dirty data as physical IOs completed. Logical operations given data redundancy (mirrors, RAID-Z, and ditto blocks) have multiple associated physical IOs. Waiting for all of them to complete would lead to lurches in the measure of outstanding dirty data. Instead, we retire a fraction of the logical size each time a physical IO completes.

By using this same metric of outstanding dirty data, we observed that we could address a seemingly unrelated, but chronic problem observed in ZFS — so called “picket-fencing”, the extreme burstiness of writes that ZFS issues to its disks. ZFS has a fixed number of concurrent outstanding IOs it issues to a device. Instead the new IO scheduler would issues a variable number of writes proportional to the amount of dirty data. With data coming in at a trickle, OpenZFS would trickle data to the backend, issuing 1 IO at a time. As incoming data rate increased, the IO scheduler would work harder, scheduling more concurrent writes in order to keep up (up to a fixed limit). As noted above, if OpenZFS couldn’t keep up with the rate of incoming data, it would insert delays also proportional to the amount of outstanding dirty data.

Results

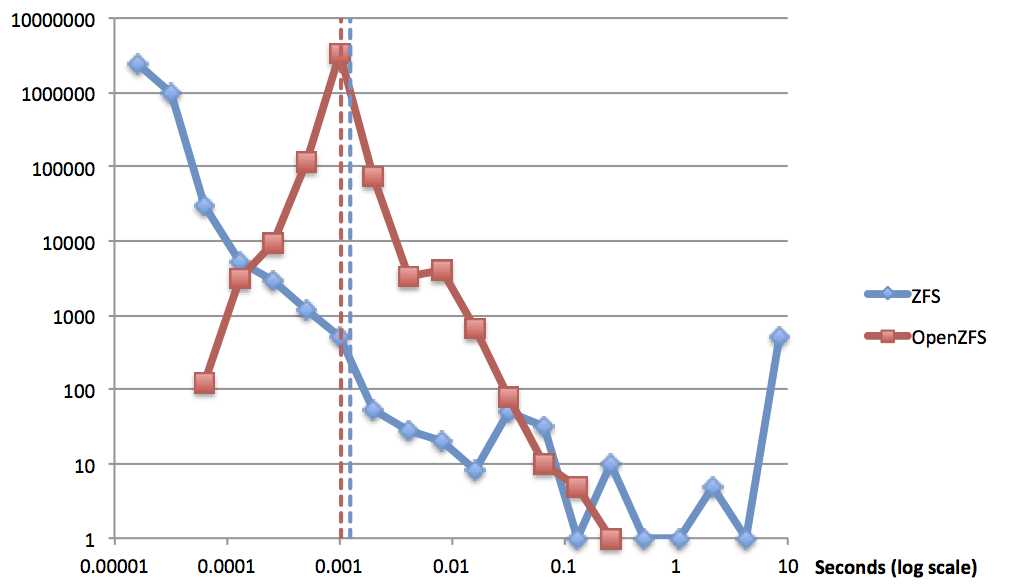
The goal was improved consistency with no increase in the average latency. The results of our tests speak for themselves (log-log scale).

Note the single-moded distribution of OpenZFS compared with the highly varied results from ZFS. You can see by the dashed lines that we managed to slightly improve the average latency (1.04ms v. 1.27ms).

OpenZFS now represents a significant improvement over ZFS with regard to consistency both of client write latency and of backend write operations. In addition, the new IO scheduler improves upon ZFS when it comes to tuning. The mysterious magic numbers and inscrutable tuneables of the old write throttle have been replaced with knobs that are comprehensible, and can be connected more directly with observed behavior. In the final post in this series, I’ll look at how to tune the OpenZFS write throttle.

It’s no small feat to build a stable, modern filesystem. The more I work with ZFS, the more impressed I am with how much it got right, and how malleable it’s proved. It has evolved to fix shortcomings and accommodate underlying technological shifts. It’s not surprising though that even while its underpinnings have withstood the test of production use, ZFS occasionally still shows the immaturity of the tween that it is.

Even before the ZFS storage appliance launched in 2008, ZFS was heavily used and discussed Solaris and OpenSolaris communities, the frequent subject of praise and criticism. A common grievance was that write-heavy workloads would consume massive amounts of system memory… and then render the system unusable as ZFS dutifully deposited the new data onto the often anemic storage (often a single spindle for OpenSolaris users).

For workloads whose ability to generate new data far outstripped the throughput of persistent storage, it became clear that ZFS needed to impose some limits. ZFS should have effective limits on the amount of system memory devoted to “dirty” (modified) data. Transaction groups should be bounded to prevent high latency IO and administrative operations. At a high level, ZFS transaction groups are just collections of writes (transactions), and there can be three transaction groups active at any given time; for a more thorough treatment, check out last year’s installment of ZFS knowledge.

Write Throttle 1.0 (2008)

The proposed solution appealed to an intuitive understanding of the system. At the highest level, don’t let transaction groups grow indefinitely. When a transaction reached a prescribed size, ZFS would create a new transaction group; if three already existed, it would block waiting for the syncing transaction group to complete. Limiting the size of each transaction group yielded a number of benefits. ZFS would no longer consume vast amounts of system memory (quelling outcry from the user community). Administrative actions that execute at transaction group boundaries would be more responsive. And synchronous, latency-sensitive operations wouldn’t have to contend with a deluge of writes from the syncing transaction group.

So how big should transaction groups be? The solution included a target duration for writing out a transaction group (5 seconds). The size of each transaction group would be based on that time target and an inferred write bandwidth. Duration times bandwidth equals target size. The inferred bandwidth would be recomputed after each transaction group.

When the size limit for a transaction group was reached, new writes would wait for the next transaction group to open. This could be nearly instantaneous if there weren’t already three transaction groups active, or it could incur a significant delay. To ameliorate this, the write throttle would insert a 10ms delay for all new writes once 7/8th of the size had been consumed.

See the gory details in the git commit.

Commentary

That initial write throttle made a comprehensible, earnest effort to address some critical problems in ZFS. And, to a degree, it succeeded. Though the lack of rigorous ZFS performance testing at that time is reflected in the glaring deficiencies with that initial write throttle. A simple logic bug lingered for other two months, causing all writes to be delayed by 10ms, not just those executed after the transaction group had reached 7/8ths of its target capacity — trivial, yes, but debilitating and telling. The computation of the write throttle resulted in values that varied rapidly; eventually a slapdash effort at hysteresis was added.

Stepping back, the magic constants arouse concern. Why should transaction groups last 5 seconds? Yes, they should be large enough to amortize metadata updates within a transaction group, and they should not be so large that they cause administrative unresponsiveness. For the ZFS storage appliance we experimented with lower values in an effort to smooth out the periodic bursts of writes — an effect we refer to as “picket-fencing” for its appearance in our IO visualization interface. Even more glaring, where did the 7/8ths cutoff come from or the 10ms worth of delay? Even if the computed throughput was dead accurate, the algorithm would lead to ZFS unnecessarily delaying writes. At first blush, this scheme was not fatally flawed, but surely arbitrary, disconnected from real results, and nearly impossible to reason about on a complex system.

Problems

The write throttle demonstrated problems more severe than the widely observed picket-fencing. While ZFS attempted to build a stable estimate of write throughput capacity, the computed number would, in practice, swing wildly. As a result, ZFS would variously over-throttle and under-throttle. It would often insert the 10ms delay, but that delay was intended merely as a softer landing than the hard limit. Once reached, the hard limit — still the primary throttling mechanism — could impose delays well in excess of a second.

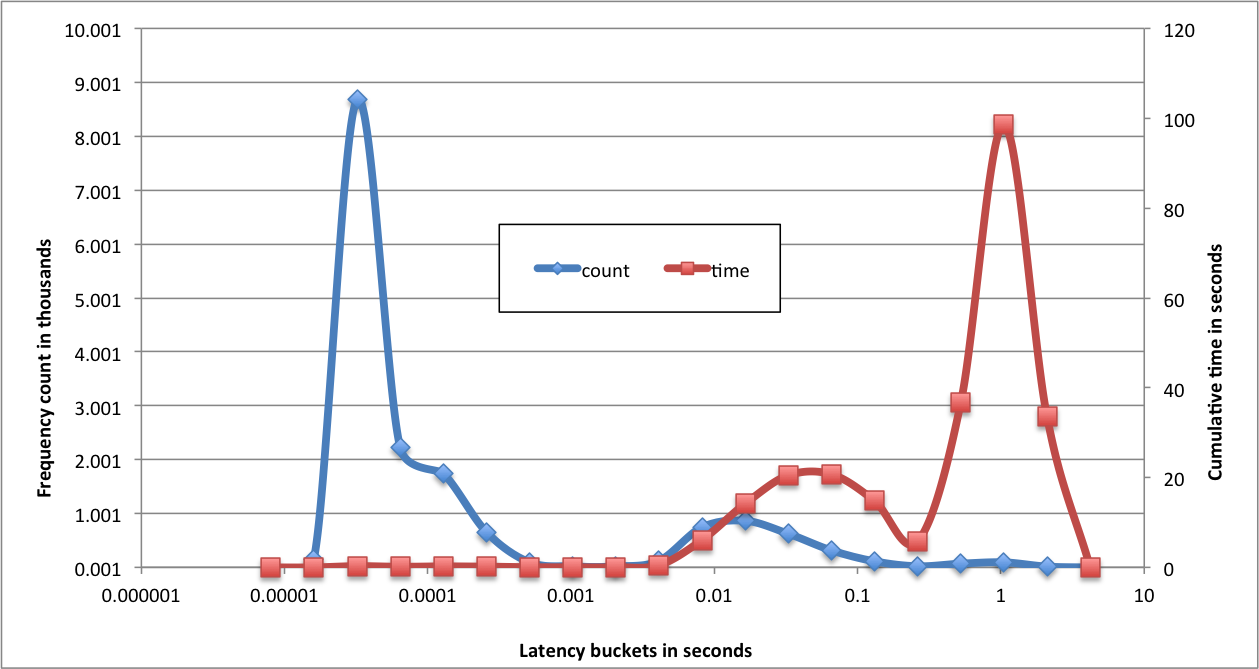
The graph below shows the frequency (count) and total contribution (time) for power-of-two IO latencies from a production system.

The latency frequencies clearly show a tri-modal distribution: writes that happen at the speed of software (much less than 1ms), writes that are delayed by the write throttle (tens of milliseconds), and writes that bump up against the transaction group size (hundred of milliseconds up to multiple seconds).

The total accumulated time for each latency bucket highlights the dramatic impact of outliers. The 110 operations taking a second or longer contribute more to the overall elapsed time than the time of the remaining 16,000+ operations.

A new focus

The first attempt at the write throttle addressed a critical need, but was guided by the need to patch a hole rather than an understanding of the fundamental problem. The rate at which ZFS can move data to persistent storage will vary for a variety of reasons: synchronous operations will consume bandwidth; not all writes impact storage in the same way — scattered writes to areas of high fragmentation may be slower than sequential writes. Regardless of the real, instantaneous throughput capacity, ZFS needs to pass on the effective cost — as measured in write latency — to the client. Write throttle 1.0 carved this cost into three tranches: writes early in a transaction group that pay nothing, those late in a transaction group that pay 10ms each, and those at the end that pick up the remainder of the bill.

If the rate of incoming data was less than the throughput capacity of persistent storage the client should be charged nothing — no delay should be inserted. The write throttle failed by that standard as well, delaying 10ms in situations that warranted no surcharge.

Ideally ZFS should throttle writes in a way that optimizes for minimized and consistent latency. As we developed a new write throttle, our objectives were low variance for write latency, and steady and consistent (rather than bursty) writes to persistent storage. In my next post I’ll describe the solution that Matt Ahrens and I designed for OpenZFS.

Recent Posts

April 17, 2024
January 13, 2024
December 29, 2023
February 12, 2017
December 18, 2016

Archives

Archives