Search
Close this search box.

Tag: DTrace

Update 8/6/2007: Those of you interested in this entry may also want to check out my next entry on the legality of a hypothetical port of DTrace to Linux.

Tools We Wish We Had — OSCON 7/26/2007

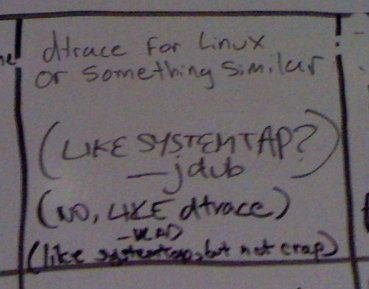
Last week at OSCON someone set up a whiteboard with the heading “Tools We Wish We Had”. People added entries (wiki-style); this one in particular caught my eye:

dtrace for Linux
or something similar

(LIKE SYSTEMTAP?)
– jdub
(NO, LIKE dtrace)
– VLAD
(like systemtap, but not crap)

DTrace

So what exactly were they asking for? DTrace is the tool developers and sysadmins have always needed — whether they knew it or not — but weren’t able to express in words let alone code. Most simply (and least humbly) DTrace lets you express a question about nearly any aspect of the system and get the answer in a simple and concise form. And — this is important — you can do it safely on machines running in production as well as in development. With DTrace, you can look at the highest level software such as Ruby (as was the subject of my talk at OSCON) through all the layers of the software stack down to the lowest level kernel facilities such as I/O and scheduling. This systemic scope, production focus, and arbitrary flexibility are completely new, and provide literally unprecedented observability into complex software systems. We’re scientists, we’re detectives — DTrace lets us form hypotheses, and prove or disprove them in an instant until we’ve come to an understanding of the problem, until we’ve solved the crime. Of course anyone using Linux would love a tool like that — especially because DTrace is already available on Mac OS X, Solaris, and FreeBSD.

SystemTap

So is SystemTap like DTrace? To understand SystemTap, it’s worth touching on the history of DTrace: Bryan cut the first code for DTrace in October of 2001; Mike tagged in moments later, and I joined up after a bit. In September of 2003 we integrated DTrace into Solaris 10 which first became available to customers in November of 2003 and formally shipped and was open-sourced in January of 2005. Almost instantly we started to see the impact in the field. In terms of performance, Solaris has strong points and weak points; with DTrace we were suddenly able to understand where those bottlenecks were on customer systems and beat out other vendors by improving our performance — not in weeks or months, but literally in a few hours. Now, I’m not saying that DTrace was the silver bullet by which all enemies were slain — that’s clearly not the case — but it was turning some heads and winning some deals.

Now, this bit involves some hearsay and conjecture[1], but apparently some managers of significance at Red Hat, IBM, and Intel started to take note. “We’ve got to do something about this DTrace,” one of them undoubtedly said with a snarl (as an underling dragged off the fresh corpse of an unlucky messenger). SystemTap was a direct reaction to the results we were achieving with DTrace — not to DTrace as an innovative technology.

When the project started in January of 2005, early discussion by the SystemTap team referred to “inspiration” that they derived from DTrace. They had a mandate to come up with an equivalent, so I assumed that they had spent the time to truly understand DTrace: to come up with an equivalent for DTrace — or really to duplicate any technology — the first step is to understand what it is completely. From day one, DTrace was designed to be used on mission critical systems, to always be safe, to induce no overhead when not in use, to allow for arbitrary data gathering, and to have systemic scope from the kernel to user-land and on up the stack into higher level languages. Those fundamental constraints led to some important, and non-obvious design decisions (e.g. our own language “D”, a micro virtual machine, conservative probe point selection).


SystemTap — the “Sorny” of dynamic tracing

Instead of taking the time to understand DTrace, and instead of using it and scouring the documentation, SystemTap charged ahead, completely missing the boat on safety with an architecture which is nearly impossible to secure (e.g. running a SystemTap script drops in a generated kernel module). Truly systemic scope remains an elusive goal as they’re only toe-deep in user-land (forget about Ruby, Java, python, etc). And innovations in DTrace such as scalable data aggregation and speculative tracing are replicated poorly if at all. By failing to examine DTrace, and by rushing to have some sort of response, SystemTap isn’t like DTrace: it’s a knockoff.

Amusingly, in an apparent attempt to salvage their self-respect, the SystemTap team later renounced their inspiration. Despite frequent mentions of DTrace in their early meetings and email, it turns out, DTrace didn’t actually inspire them much at all:

CVSROOT:	/cvs/systemtap
Module name:	src
Changes by:	kenistoj@sourceware.org	2006-11-02 23:03:09
Modified files:
.              : stap.1.in
Log message:
Removed refs to dtrace, to which we were giving undue credit in terms of
"inspiration."
you’re not my real dad! <slam>

Bad Artists Copy…

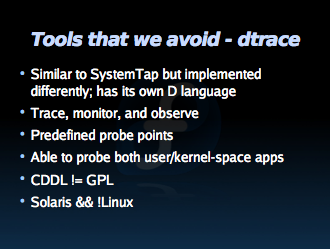
So uninspired was the SystemTap team by DTrace, that they don’t even advocate its use according to a presentation on profiling applications (“Tools that we avoid – dtrace [sic]”). In that same presentation there’s an example of a SystemTap-based tool called udpstat.stp:

$ udpstat.stp
UDP_out  UDP_outErr  UDP_in  UDP_inErr  UDP_noPort
0           0       0          0           0
0           0       0          0           0
4           0       0          0           0
5           0       0          0           0
5           0       0          0           0

… whose output was likely “inspired” by udpstat.d — part of the DTraceToolkit by Brendan Gregg:

# udpstat.d
UDP_out  UDP_outErr   UDP_in  UDP_inErr  UDP_noPort
0           0        0          0           1
0           0        0          0           2
0           0        0          0           0
1165           0        2          0           0

In another act of imitation reminiscent of liberal teenage borrowing from wikipedia, take a look at Eugene Teo’s slides from Red Hat Summit 2007 as compared with Brendan’s DTrace Topics Intro wiki (the former apparently being generated by applying a sed script to the latter). For example:

What isn’t SystemTap

  • SystemTap isn’t sentient; requires user thinking process
  • SystemTap isn’t a replacement for any existing tools

What isn’t DTrace

  • DTrace isn’t a replacement for kstat or SMNP
    • kstat already provides inexpensive long term monitoring.
  • DTrace isn’t sentient, it needs to borrow your brain to do the thinking
  • DTrace isn’t “dTrace”

… Great Artists Steal

While some have chosen the knockoff route, others have taken the time to analyze what DTrace does, understood the need, and decided that the best DTrace equivalent would be… DTrace. As with the rest of Solaris, DTrace is open source so developers and customers are excited about porting. Just a few days ago there were a couple of interesting blog posts (here and here) by users of ONTAP, NetApp’s appliance OS, not for a DTrace equivalent, but for a port of DTrace itself.

DTrace is already available in the developer builds of Mac OS X 10.5, and there’s a functional port for FreeBSD. I don’t think it’s a stretch to say that DTrace itself is becoming the measuring stick — if not the standard. Why reinvent the wheel when you can port it?

Time For Standards

At the end of my talk last week someone asked if there was a port of DTrace to Linux (not entirely surprising since OSCON has a big Linux user contingent). I told him to ask the Linux bigwigs (several of them were also at the conference); after all, we didn’t do the port to Mac OS X, and we didn’t do the port to FreeBSD. We did extend our help to those developers, and they, in turn, helped DTrace by growing the community and through direct contributions[2].

We love to see DTrace on other operating systems, and we’re happy to help.

So to the pretenders: enough already with the knockoffs. Your users want DTrace, you obviously want what DTrace offers, and the entire DTrace team and community are eager to help. I’m sure there’s been some FUD about license incompatibilities, but it’s certainly Sun’s position (as stated by Sun’s CEO Jonathan Schwartz at OSCON 2005) that such a port wouldn’t violate the OpenSolaris license. And even closed-source kernel components are tolerated from the likes of Symantec (nee Veritas) and nVidia. Linux has been a champion of standards, eschewing proprietary solutions for free and open standards. DTrace might not yet be a standard, but a DTrace knockoff never will be.

[1] … those are kinds of evidence
[2] including posts on the DTrace discussion forum comprehensible only to me and James

With BrandZ, it’s now possible to use DTrace on Linux applications. For the uninitiated, DTrace is the dynamic tracing facility in OpenSolaris; it allows for systemic analysis of a scope and precision unequalled in the industry. With DTrace, administrators and developers can trace low level services like I/O and scheduling, up the system stack through kernel functions calls, system calls, and system library calls, and into applications written in C and C++ or any of a host of dynamic languages like Java, Ruby, Perl or php. One of my contributions to BrandZ was to extend DTrace support for Linux binaries executed in a branded Zone.

DTrace has several different instrumentation providers that know how to instrument a particular part of the system and provide relevant probes for that component. The io provider lets you trace disk I/O, the fbt (function boundary tracing) provider lets you trace any kernel function call, etc. A typical system will start with more than 30,000 probes but providers can create probes dynamically to trace new kernel modules or user-land processes. When strictly focused on a user-land application, the most useful providers are typically the syscall provider to examine system calls and the pid provider that can trace any instruction in a any process executing on the system.

For Linux processes, the pid provider just worked (well, once Russ built a library to understand the Linux run-time linker), and we introduced a new provider — the lx-syscall provider — to trace entry and return for emulated Linux system calls. With these providers it’s possible to understand every facet of a Linux application’s behavior and with the other DTrace probes it’s possible to reason about an application’s use of system resources. In other words, you can take that sluggish Linux application, stick it in a branded Zone, dissect it using Solaris tools, and then bring it back to a native Linux system with the fruits of your DTrace investigation[1].

To give an example of using DTrace on Linux applications, I needed an application to examine. I wanted a well known program that either didn’t run on Solaris or operated sufficiently differently such examining the Linux version rather than the Solaris port made sense. I decided on /usr/bin/top partly because of the dramatic differences between how it operates on Linux vs. Solaris (due to the differences in /proc), but mostly because of what I’ve heard my colleague, Bryan, refer to as the “top problem”: your system is slow, so you run top. What’s the top process? Top!

Running top in the Linux branded zone, I opened a shell in the global (Solaris) zone to use DTrace. I started as I do on Solaris applications: I looked at system calls. I was interested to see which system calls were being executed most frequently which is easily expressed in DTrace:

bash-3.00# dtrace -n lx-syscall:::entry'/execname == "top"/{ @[probefunc] = count(); }'
dtrace: description 'lx-syscall:::entry' matched 272 probes
^C
fstat64                                                         322
access                                                          323
gettimeofday                                                    323
gtime                                                           323
llseek                                                          323
mmap2                                                           323
munmap                                                          323
select                                                          323
getdents64                                                     1289
lseek                                                          1291
stat64                                                         3545
rt_sigaction                                                   5805
write                                                          6459
fcntl64                                                        6772
alarm                                                          8708
close                                                         11282
open                                                          14827
read                                                          14830

Note the use of the aggregation denoted with the ‘@’. Aggregations are the mechanism by which DTrace allows users to examine patterns of system behavior rather than examining each individual datum — each system call for example. (In case you also noticed the strange discrepancy between the number of open and close system calls, many of those opens are failing so it makes sense that they would have no corresponding close. I used the lx-syscall provider to suss this out, but I omitted that investigation in a vain appeal for brevity.)

There may well be something fishy about this output, but nothing struck me as so compellingly fishy to explore immediately. Instead, I fired up vi and wrote a short D script to see which system calls were taking the most time:

lx-sys.d

#!/usr/sbin/dtrace -s
lx-syscall:::entry
/execname == "top"/
{
        self->ts = vtimestamp;
}
lx-syscall:::return
/self->ts/
{
        @[probefunc] = sum(vtimestamp - self->ts);
        self->ts = 0;
}

This script creates a table of system calls and the time spent in them (in nanoseconds). The results were fairly interesting.

bash-3.00# ./lx-sys.d
dtrace: script './lx-sys.d' matched 550 probes
^C
llseek                                                      4940978
gtime                                                       5993454
gettimeofday                                                6603844
fstat64                                                    14217312
select                                                     26594875
lseek                                                      30956093
mmap2                                                      43463946
access                                                     49033498
alarm                                                      72216971
fcntl64                                                   188281402
rt_sigaction                                              197646176
stat64                                                    268188885
close                                                     417574118
getdents64                                                781844851
open                                                     1314209040
read                                                     1862007391
write                                                    2030173630
munmap                                                   2195846497

That seems like a lot of time spent in munmap for top. In fact, I’m rather surprised that there’s any mapping and unmapping going on at all (I guess that should have raised an eyebrow after my initial system call count). Unmapping memory is a pretty expensive operation that gets more expensive on bigger systems as it requires the kernel to do some work on every CPU to completely wipe out the mapping.

I then modified lx-sys.d to record the total amount of time top spent on the CPU and the total amount of time spent in system calls to see how large a chunk of time these seemingly expensive unmap operations were taking:

lx-sys2.d

#!/usr/sbin/dtrace -s
lx-syscall:::entry
/execname == "top"/
{
        self->ts = vtimestamp;
}
lx-syscall:::return
/self->ts/
{
        @[probefunc] = sum(vtimestamp - self->ts);
        @["- all syscalls -"] = sum(vtimestamp - self->ts);
        self->ts = 0;
}
sched:::on-cpu
/execname == "top"/
{
        self->on = timestamp;
}
sched:::off-cpu
/self->on/
{
        @["- total -"] = sum(timestamp - self->on);
        self->on = 0;
}

I used the sched provider to see when top was going on and off of the CPU, and I added a row to record the total time spent in all system call. Here were the results (keep in mind I was just hitting ^C to end the experiment after a few seconds so it’s expected that these numbers would be different from those above; there are ways to have more accurately timed experiments):

bash-3.00# ./lx-sys2.d
dtrace: script './lx-sys2.d' matched 550 probes
^C
llseek                                                       939771
gtime                                                       1088745
gettimeofday                                                1090020
fstat64                                                     2494614
select                                                      4566569
lseek                                                       5186943
mmap2                                                       7300830
access                                                      8587484
alarm                                                      11671436
fcntl64                                                    31147636
rt_sigaction                                               33207341
stat64                                                     45223200
close                                                      69338595
getdents64                                                131196732
open                                                      220188139
read                                                      309764996
write                                                     340413183
munmap                                                    365830103
- all syscalls -                                         1589236337
- total -                                                3258101690

So system calls are consuming roughly half of top’s time on the CPU and the munmap syscall is consuming roughly a quarter of that. This was enough to convince me that there was probably room for improvement and further investigation might bear fruit.

Next, I wanted to understand what this mapped memory was being used for so I wrote a little script that traces all the functions called in the process between when memory is mapped using the mmap2(2) system call and when it’s unmapped and returned to the system through the munmap(2) system call:

map.d

#!/usr/sbin/dtrace -s
#pragma D option quiet
lx-syscall::mmap2:return
/pid == $target/
{
        self->ptr = arg1;
        self->depth = 10;
        printf("%*.s depth, "", probefunc);
}
pid$target:::entry
/self->ptr/
{
        self->depth++;
        printf("%*.s -> %s`%s\n", self->depth, "", probemod, probefunc);
}
pid$target:::return
/self->ptr/
{
        printf("%*.s depth, "", probemod, probefunc);
        self->depth--;
}
lx-syscall::munmap:entry
/arg0 == self->ptr/
{
        self->depth++;
        printf("%*.s -> %s syscall\n", self->depth, "", probefunc);
        self->ptr = 0;
        self->depth = 0;
        exit(0);
}

This script uses the $target variable which means that we need to run it with the -p option where is the process ID of top. When mmap2 returns, we set a thread local variable, ‘ptr’, which stores the address at the base of the mapped region; for every function entry and return in the process we call printf() if self->ptr is set; finally, we exit DTrace when munmap is called with that same address. Here are the results:

bash-3.00# ./map.d -p `pgrep top`
<- mmap2 syscall
<- LM2`libc.so.1`syscall
<- LM2`lx_brand.so.1`lx_emulate
<- LM2`lx_brand.so.1`lx_handler
<- libc.so.6`mmap
 libc.so.6`memset
 libc.so.6`cfree
 libc.so.6`munmap
 LM2`lx_brand.so.1`lx_handler
-> LM2`lx_brand.so.1`lx_emulate
-> LM2`libc.so.1`syscall
-> munmap syscall

I traced the probemod (shared object name) in addition to probefunc (function name) so that we’d be able to differentiate proper Linux functions (in this case all in libc.so.6) from functions in the emulation library (LM2`lx_brand.so.1). What we can glean from this is that the mmap call is a result of a call to malloc() and the unmap is due to a call to free(). What’s unfortunate is that we’re not seeing any function calls in top itself. For some reason, the top developer chose to strip this binary (presumably to save precious 2k the symbol table would have used on disk) so we’re stuck with no symbolic information for top’s functions and no ability to trace the individual function calls[2], but we can still reason about this a bit more.

A little analysis in mdb revealed that cfree (an alias for free) makes a tail-call to a function that calls munmap. It seems strange to me that freeing memory would immediately results in an unmap operation (since it would cause exactly the high overhead we’re seeing here. To explore this, I wrote another script which looks at what proportion of calls to malloc result in a call to mmap():

malloc.d

#!/usr/sbin/dtrace -s
pid$target::malloc:entry
{
        self->follow = arg0;
}
lx-syscall::mmap2:entry
/self->follow/
{
        @["mapped"] = count();
        self->follow = 0;
}
pid$target::malloc:return
/self->follow/
{
        @["no map"] = count();
        self->follow = 0;
}

Here are the results:

bash-3.00# ./malloc.d -p `pgrep top`
dtrace: script './malloc.d' matched 11 probes
^C
mapped                                                          275
no map                                                         3024

So a bunch of allocations result in a mmap, but not a huge number. Next I decided to explore if there might be a correlation between the size of the allocation and whether or not it resulted in a call to mmap using the following script:

malloc2.d

#!/usr/sbin/dtrace -s
pid$target::malloc:entry
{
        self->size = arg0;
}
lx-syscall::mmap2:entry
/self->size/
{
        @["mapped"] = quantize(self->size);
        self->size = 0;
}
pid$target::malloc:return
/self->size/
{
        @["no map"] = quantize(self->size);
        self->size = 0;
}

Rather than just counting the frequency, I used the quantize aggregating action to built a power-of-two histogram on the number of bytes being allocated (self->size). The output was quite illustrative:

bash-3.00# ./malloc2.d -p `pgrep top`
dtrace: script './malloc2.d' matched 11 probes
^C
no map
 value  ------------- Distribution ------------- count
     2 |                                         0
     4 |@@@@@@@                                  426
     8 |@@@@@@@@@@@@@@@                          852
    16 |@@@@@@@@@@@                              639
    32 |@@@@                                     213
    64 |                                         0
   128 |                                         0
   256 |                                         0
   512 |@@@@                                     213
  1024 |                                         0
mapped
 value  ------------- Distribution ------------- count
131072 |                                         0
262144 |@@@@@@@@@@@@@@@@@@@@@@@@@@@@@@@@@@@@@@@@ 213
524288 |                                         0

All the allocations that required a mmap were huge — between 256k and 512k. Now it makes sense why the Linux libc allocator would treat these allocations a little differently than reasonably sized allocations. And this is clearly a smoking gun for top performance: it would do much better to preallocate a huge buffer and grow it as needed (assuming it actually needs it at all) than to malloc it each time. Tracking down the offending line of code would just require a non-stripped binary and a little DTrace invocation like this:

# dtrace -n pid`pgrep top`::malloc:entry'/arg0 >= 262144/{@[ustack()] = count()}'

From symptoms to root cause on a Linux application in a few DTrace scripts — and it took me approximately 1000 times longer to cobble together some vaguely coherent prose describing the scripts than it did for me to actually perform the investigation. BrandZ opens up some pretty interesting new vistas for DTrace. I look forward to seeing Linux applications being brought in for tune-ups on BrandZ and then reaping those benefits either back on their mother Linux or sticking around to enjoy the fault management, ZFS, scalability, and, of course, continued access to DTrace in BrandZ.


[1] Of course, results may vary since the guts of the Linux kernel differ significantly from those of the Solaris kernel, but they’re often fairly similar. I/O or scheduling problems will be slightly different, but often not so different that the conclusions lack applicability.
[2] Actually, we can can still trace function calls — in fact, we can trace any instruction — but it takes something of a heroic effort. We could disassemble parts of top to identify calls sites and then use esoteric pid123::-:address probe format to trace the stripped function. I said we could do it; I never said it would be pretty.


Technorati Tags:

Recent Posts

April 17, 2024
January 13, 2024
December 29, 2023
February 12, 2017
December 18, 2016

Archives

Archives