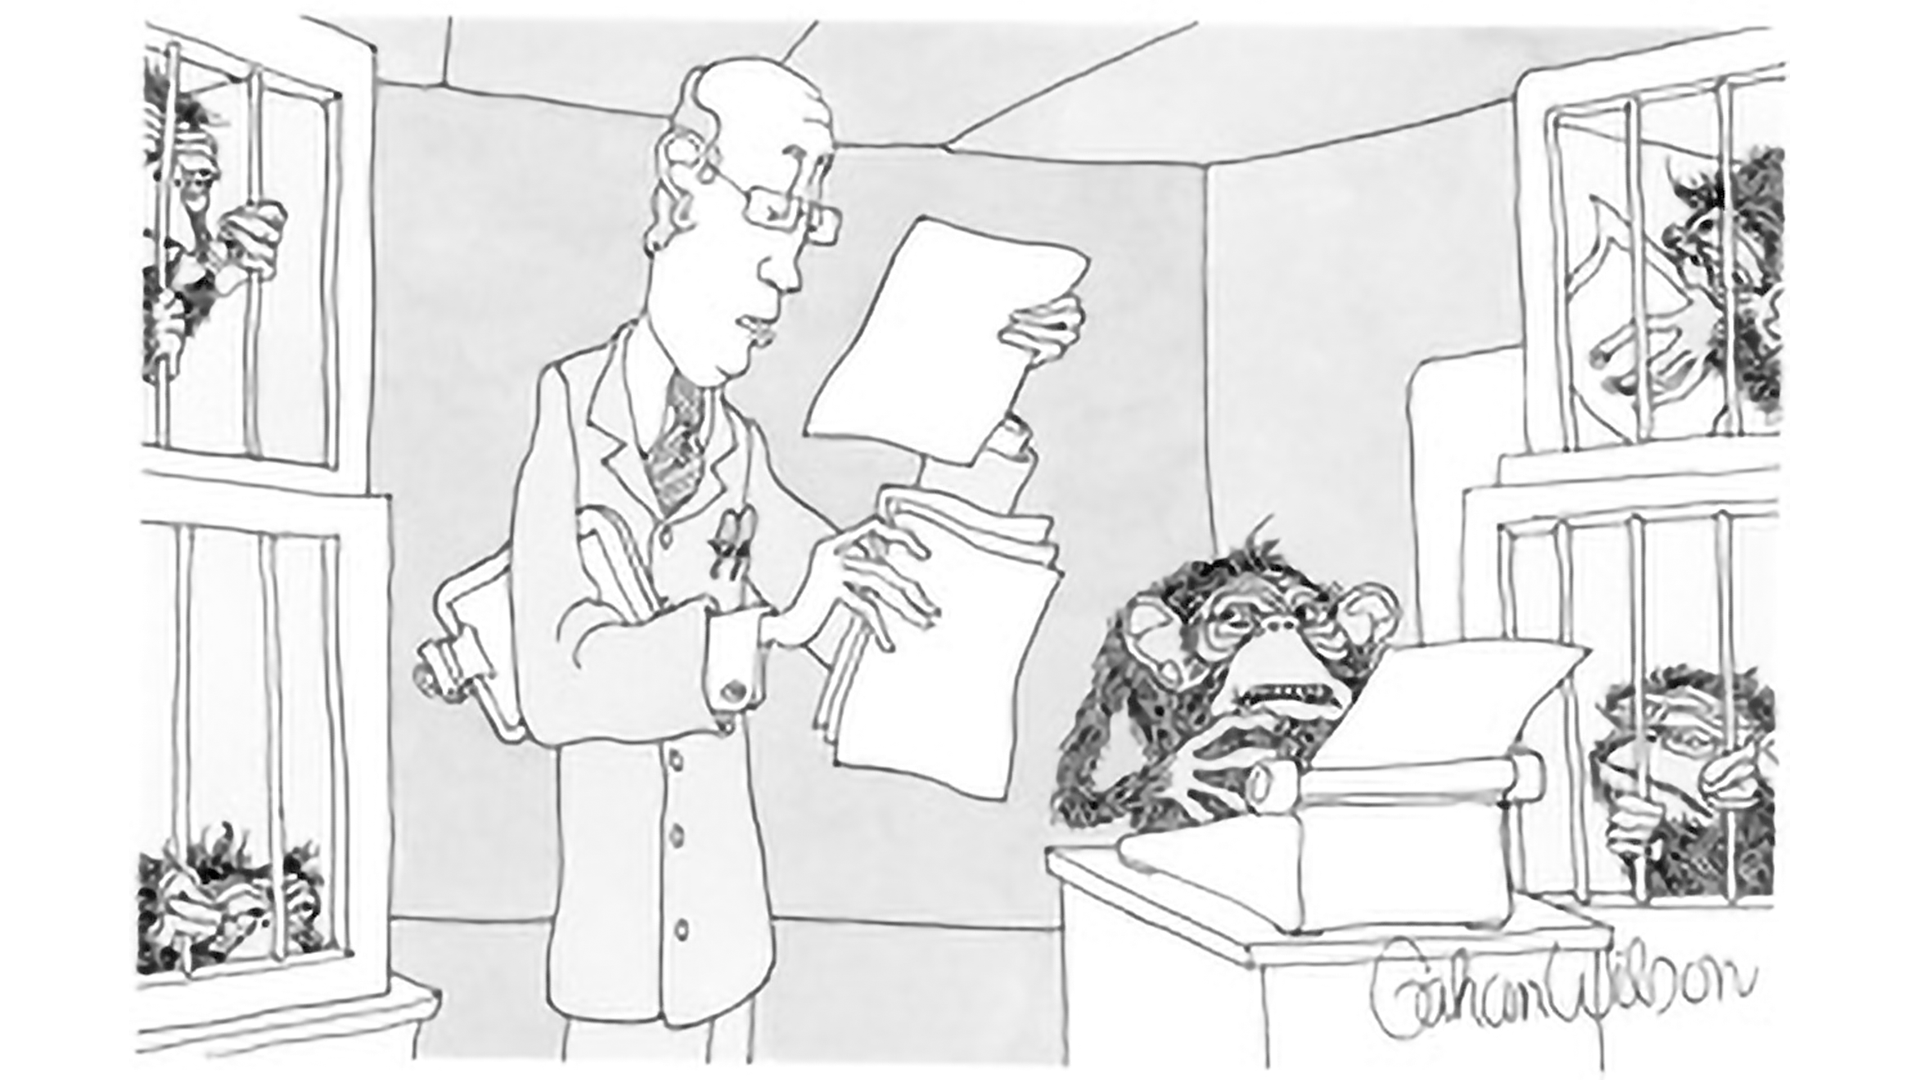
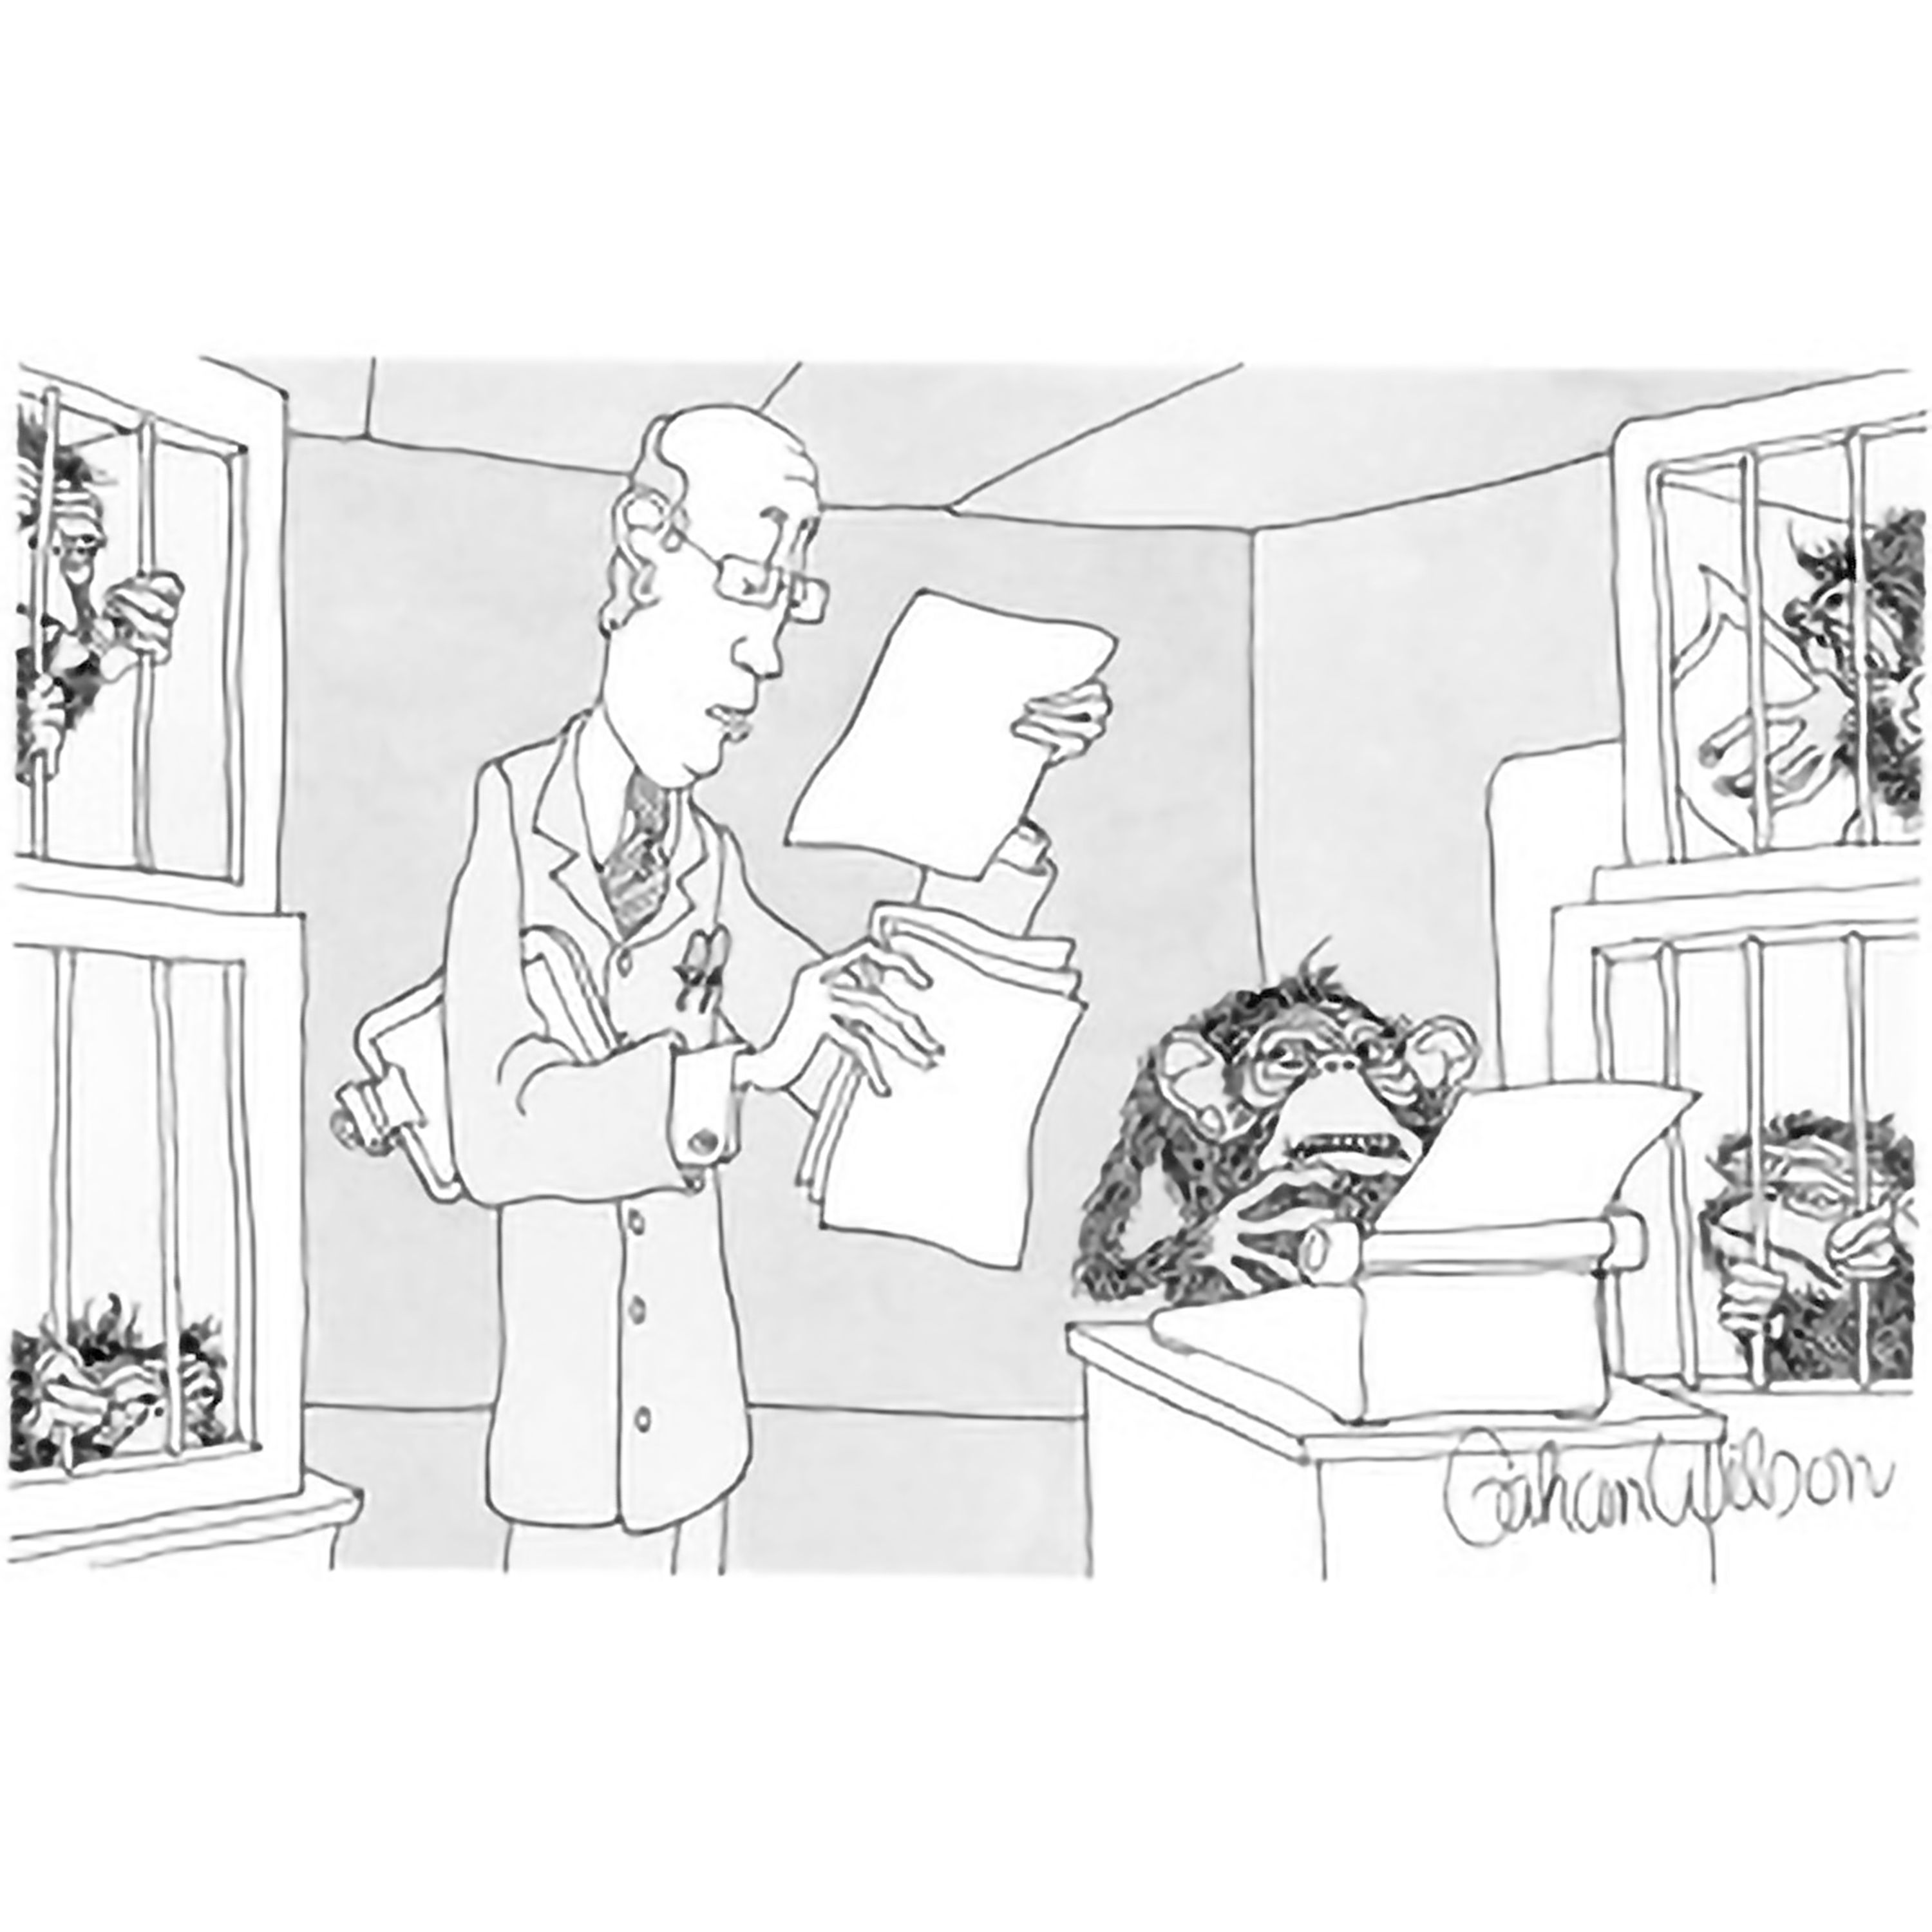
dtrace.conf(24)
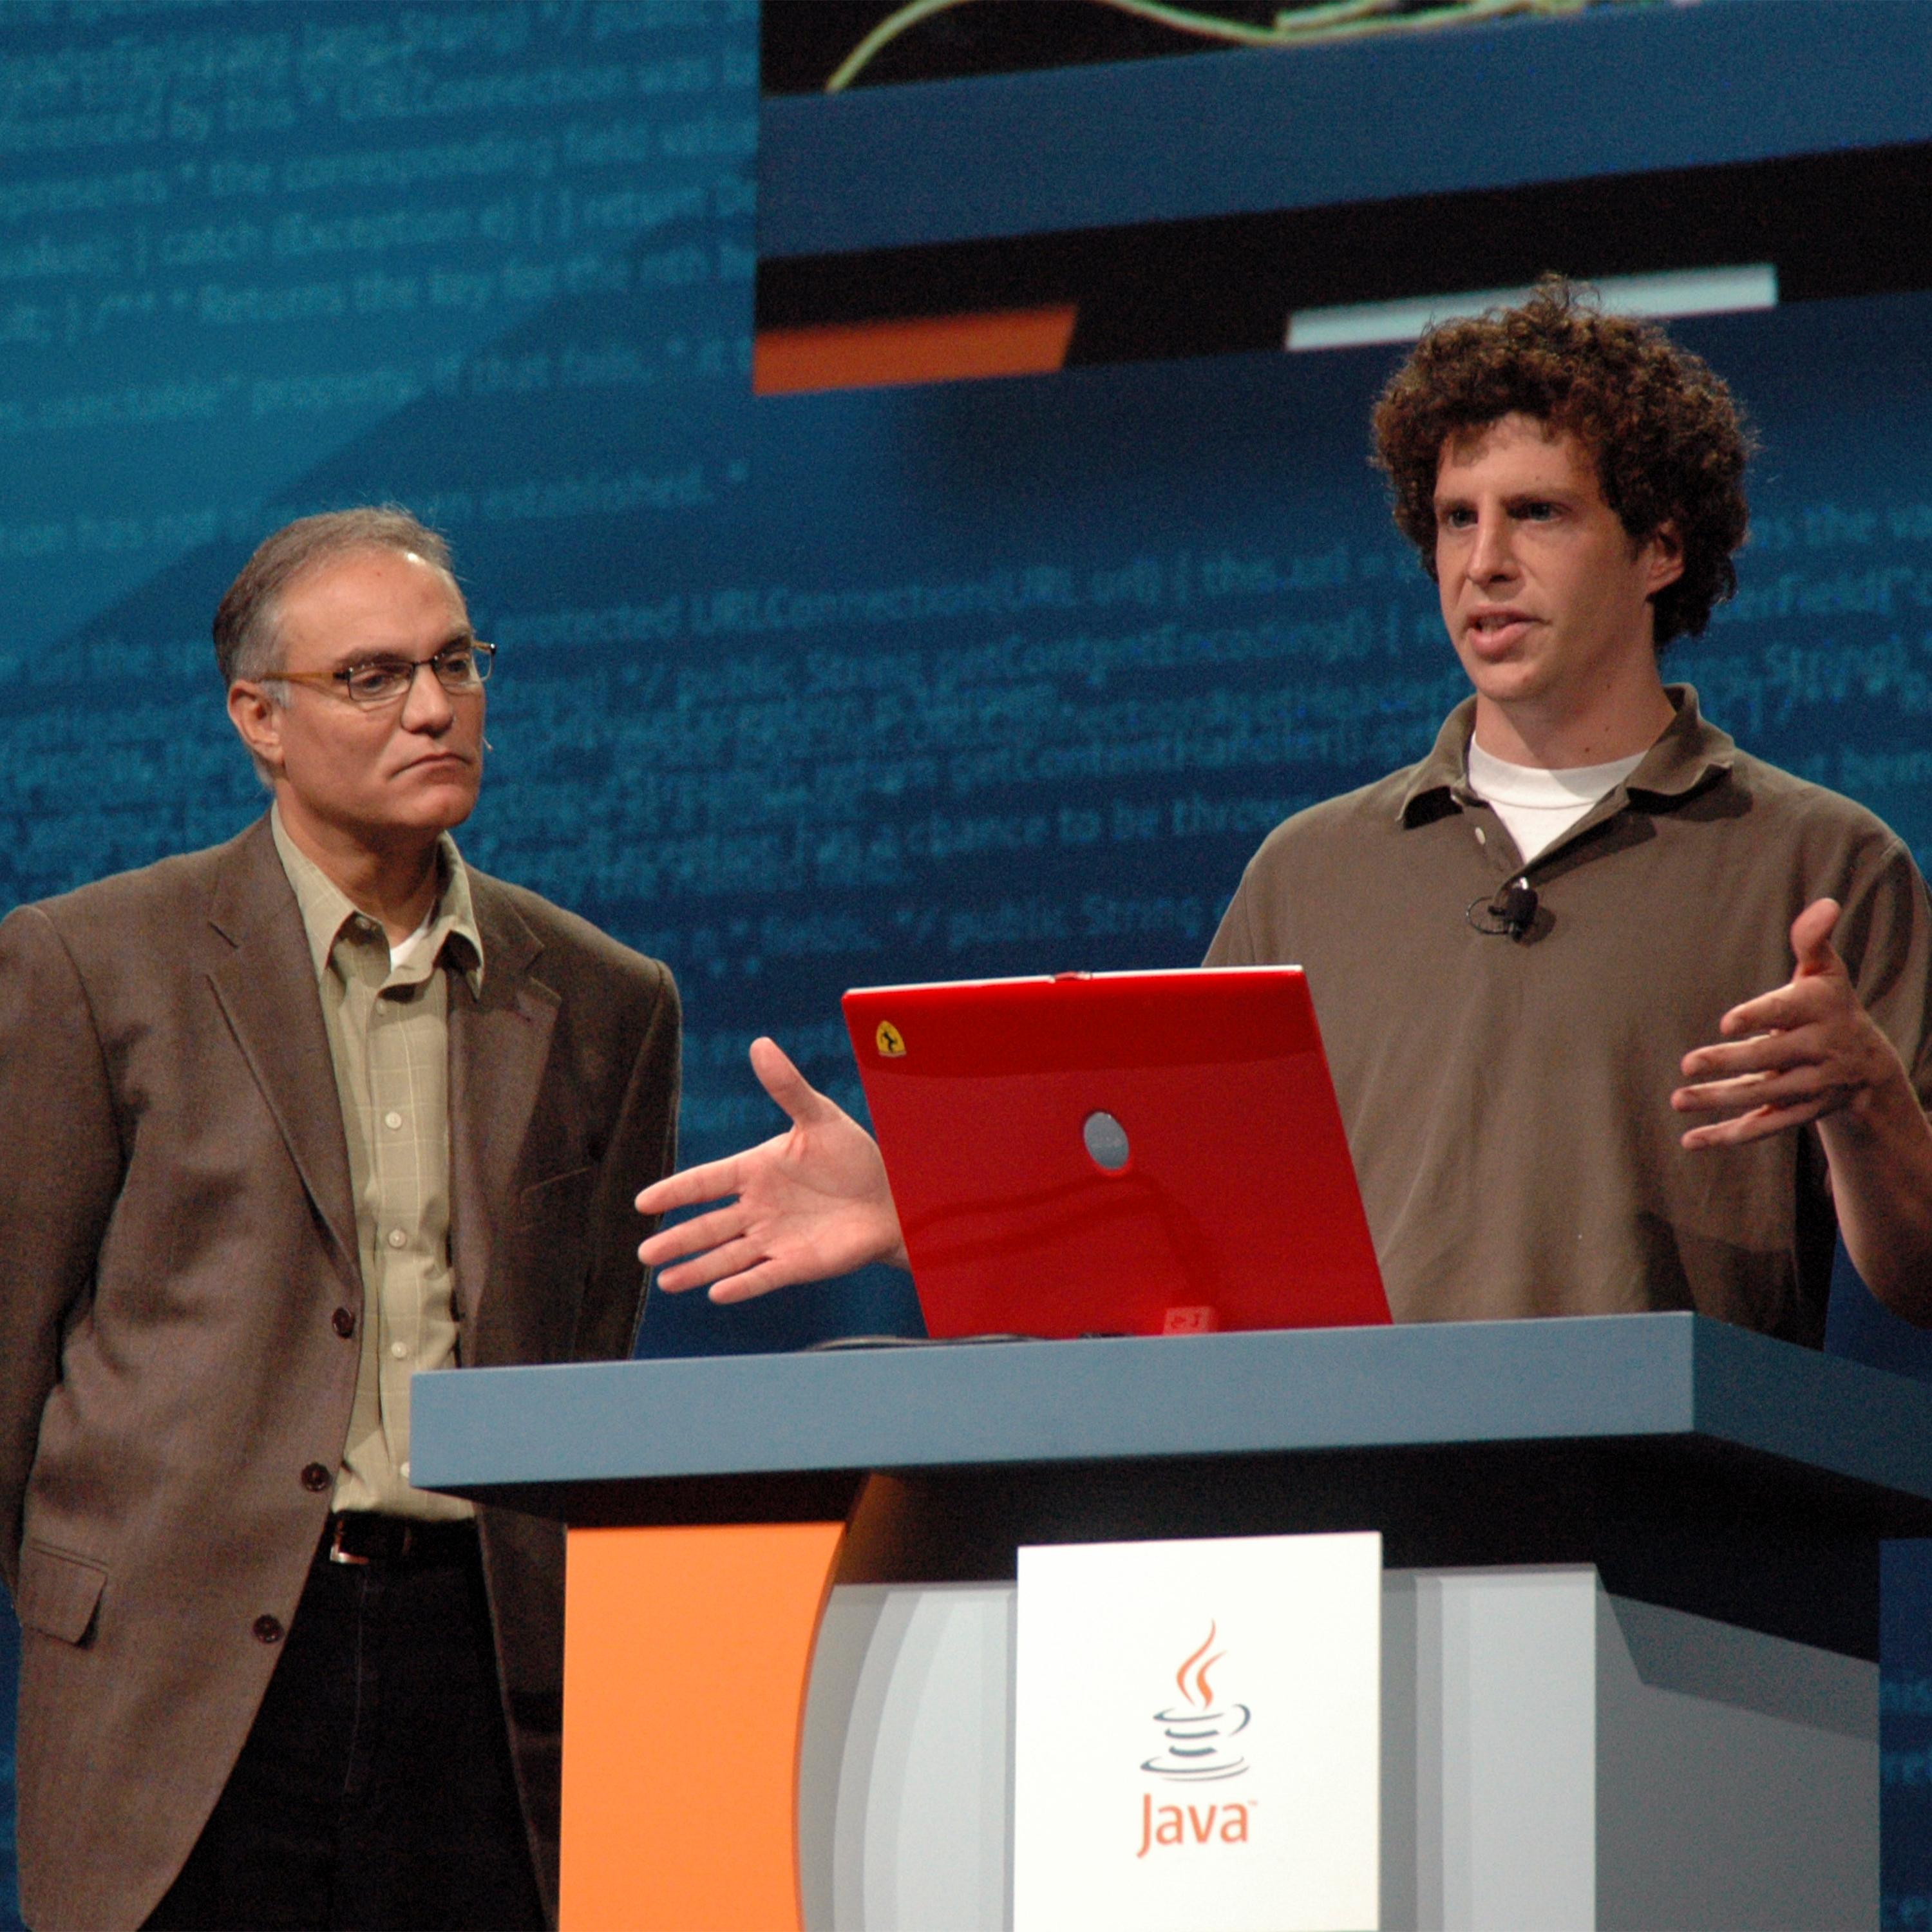
A few weeks ago, Oxide hosted dtrace.conf(24), the (mostly) quadrennial DTrace conference. We started the conference in 2008, continuing in 2012 and 2016. When I joined Oxide in 2020; it felt like stars aligning for dtrace.conf(20)… ultimately canceled due to Covid. This year, we moved the conference online. As an unconference, we’re very reliant on folks showing up ready to present. Would we even have enough speakers to get us through lunchtime? It turned out that Bryan and my hand-wringing was unwarranted: we had a great, full day of presentations both from folks we knew (invited, and cajoled) and some new faces.
We recorded the livestream and I assembled each talk into a video (with mostly light, and sometimes less-light editing to cover up AV glitches). Enjoy!
Bryan kicked us off with the State of the Union. The evolution of DTrace and of dtrace.conf. I share his appreciation that 20+ years after releasing DTrace, there’s still a community of users, developers, and speakers!
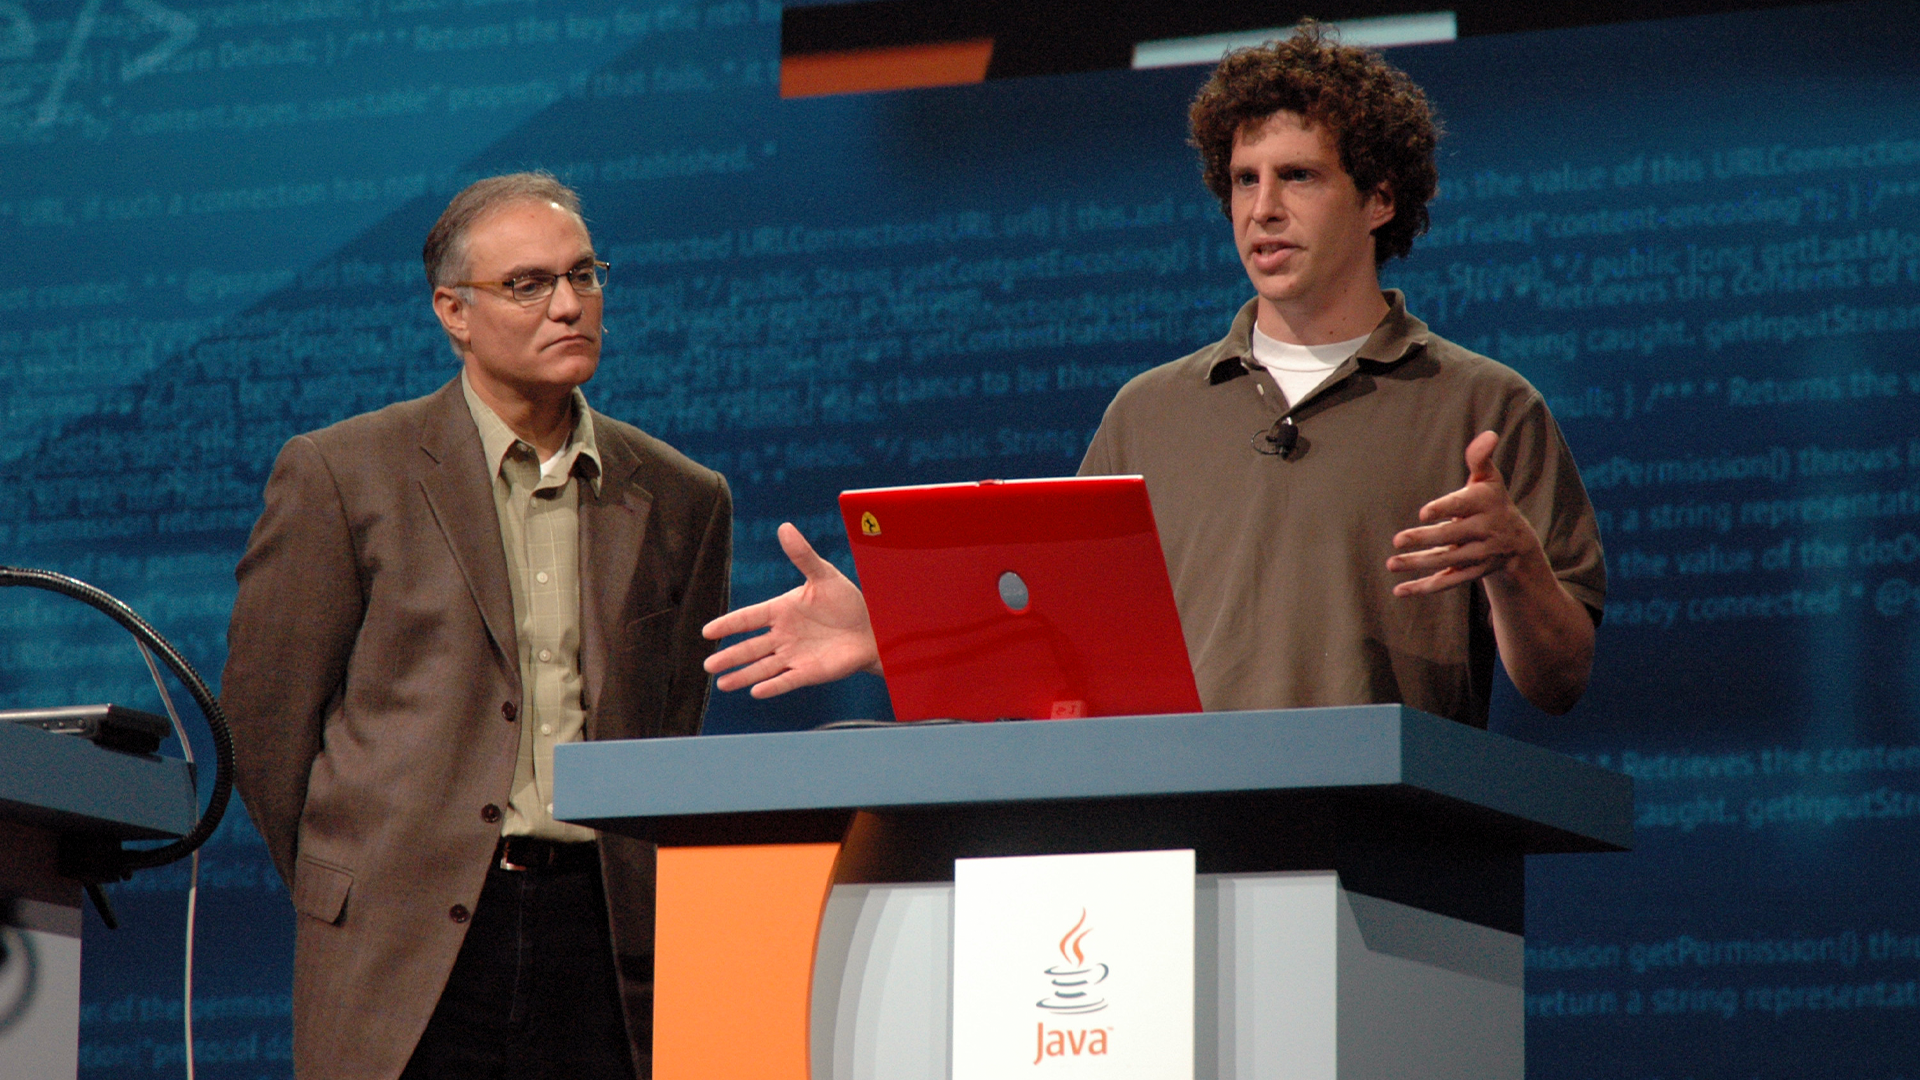
Ben and I then presented our work on the Rust usdt crate for adding USDT probes to Rust code. This turned out not only to be incredibly useful for us at Oxide, but also foundational for several of the talks that followed.
Kyle showed innovative of in-kernel SDT with Rust at Oxide.
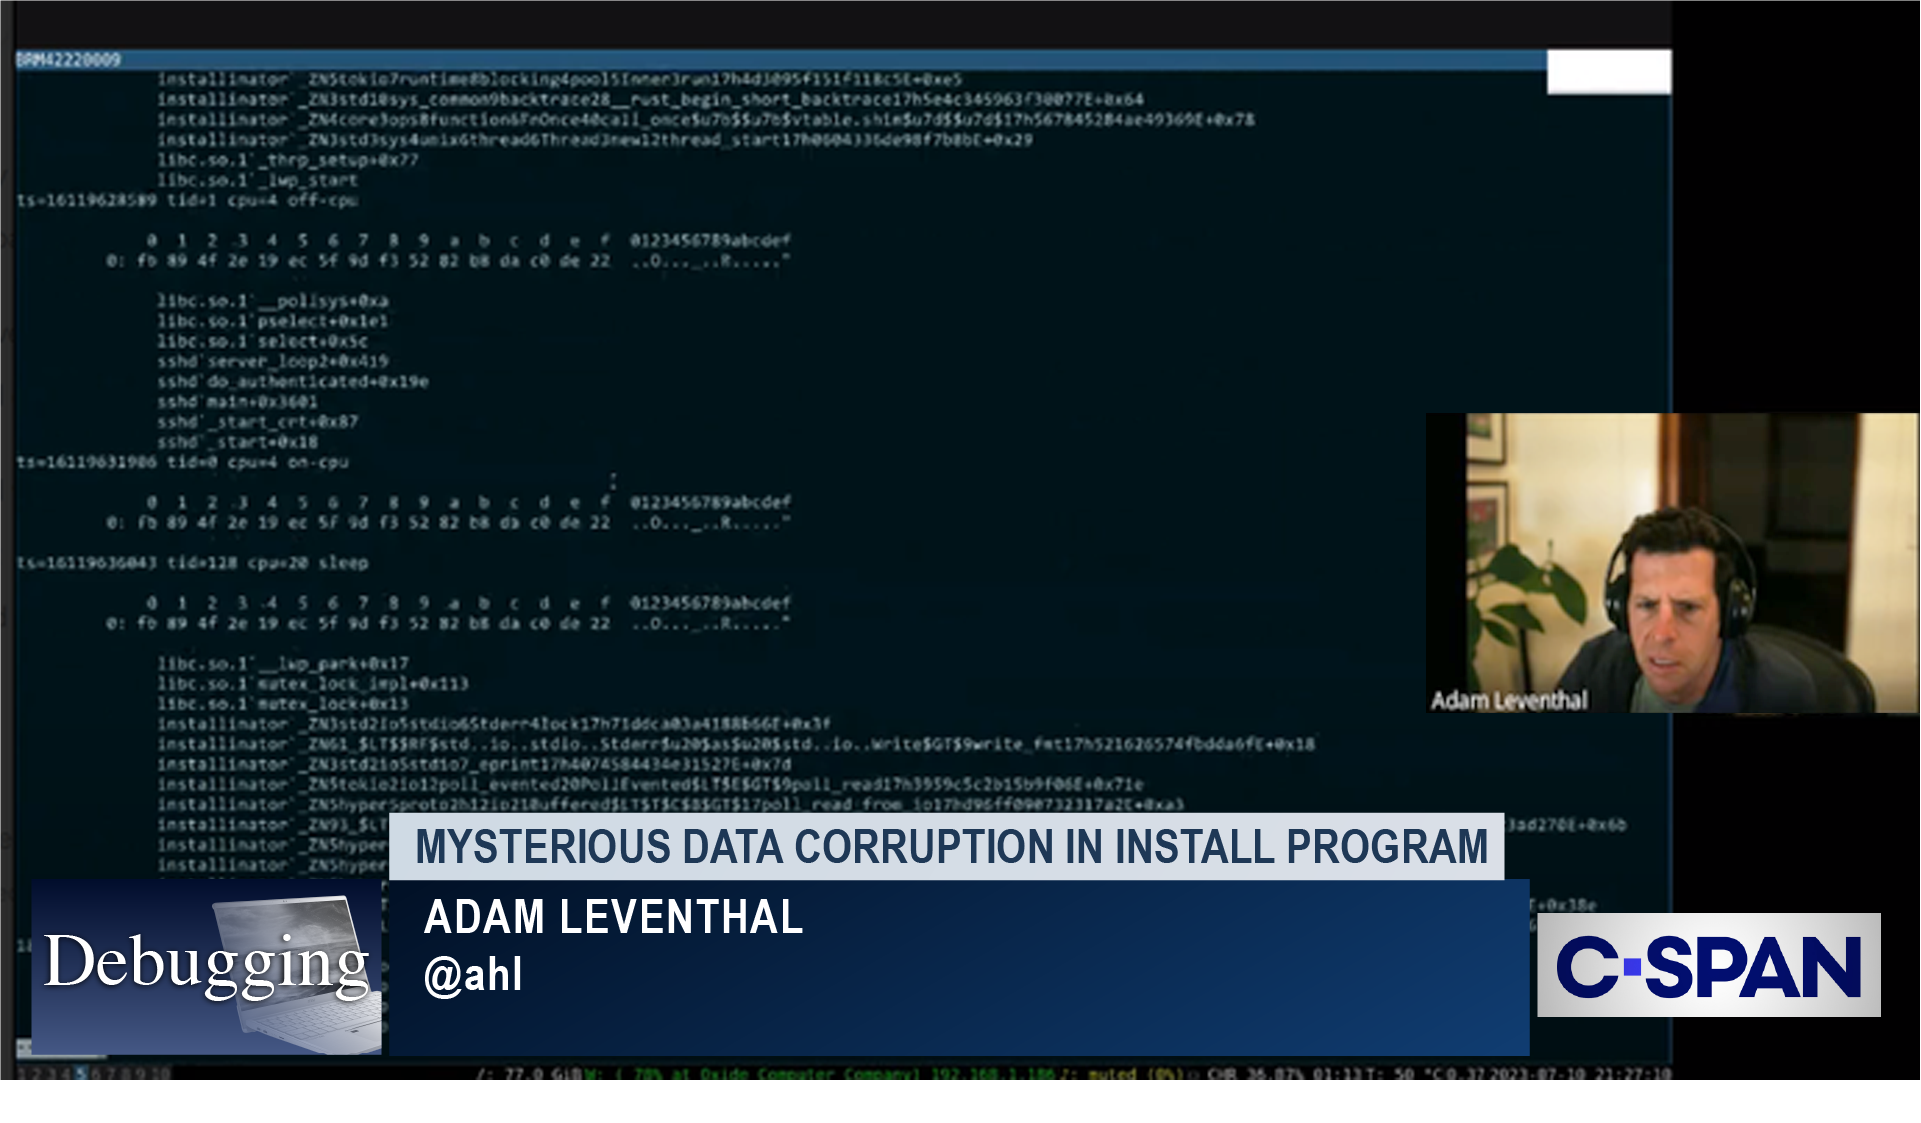
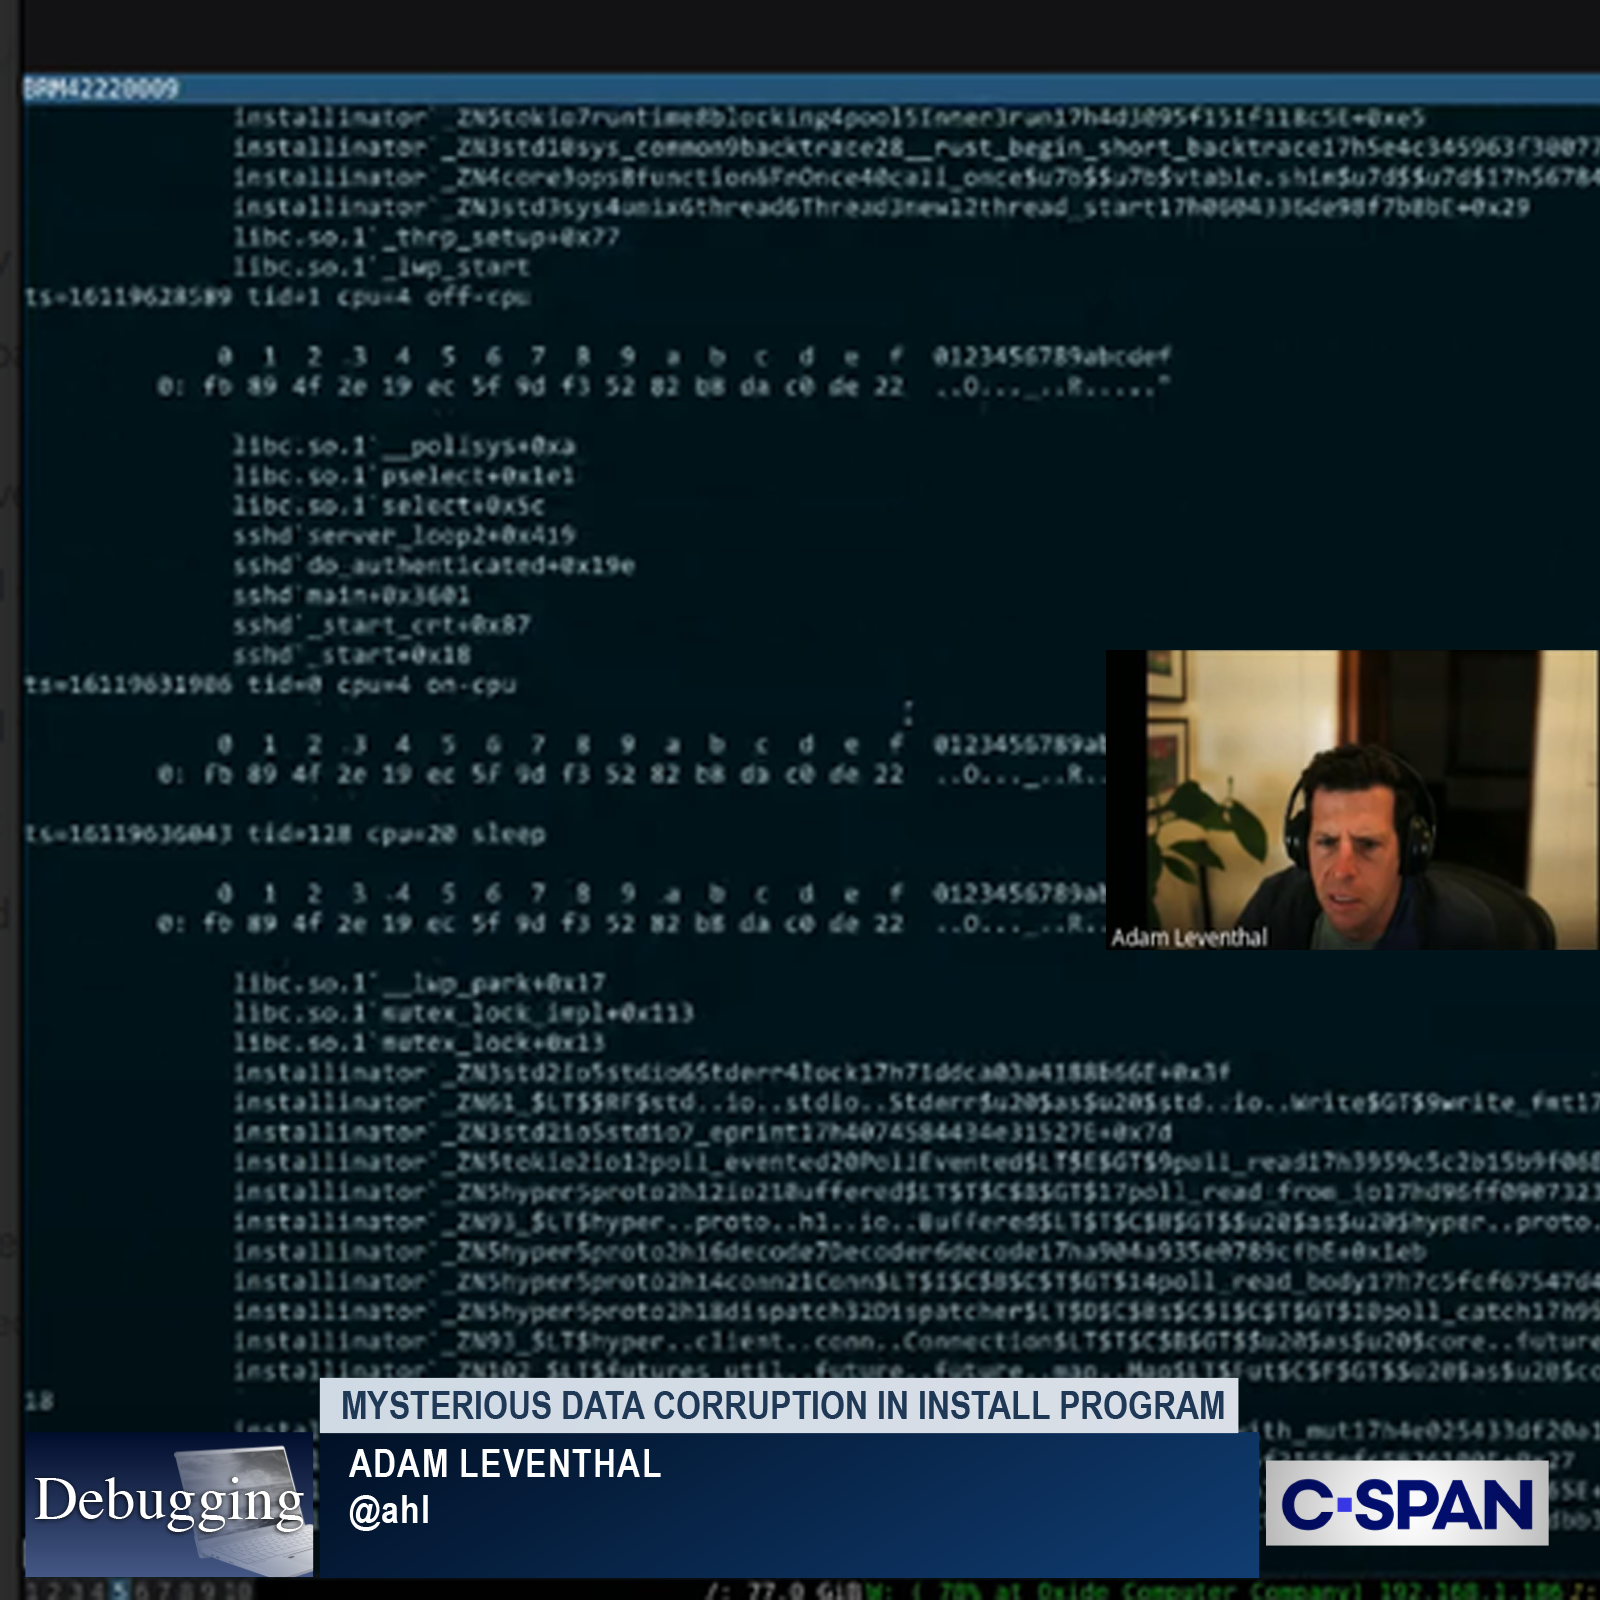
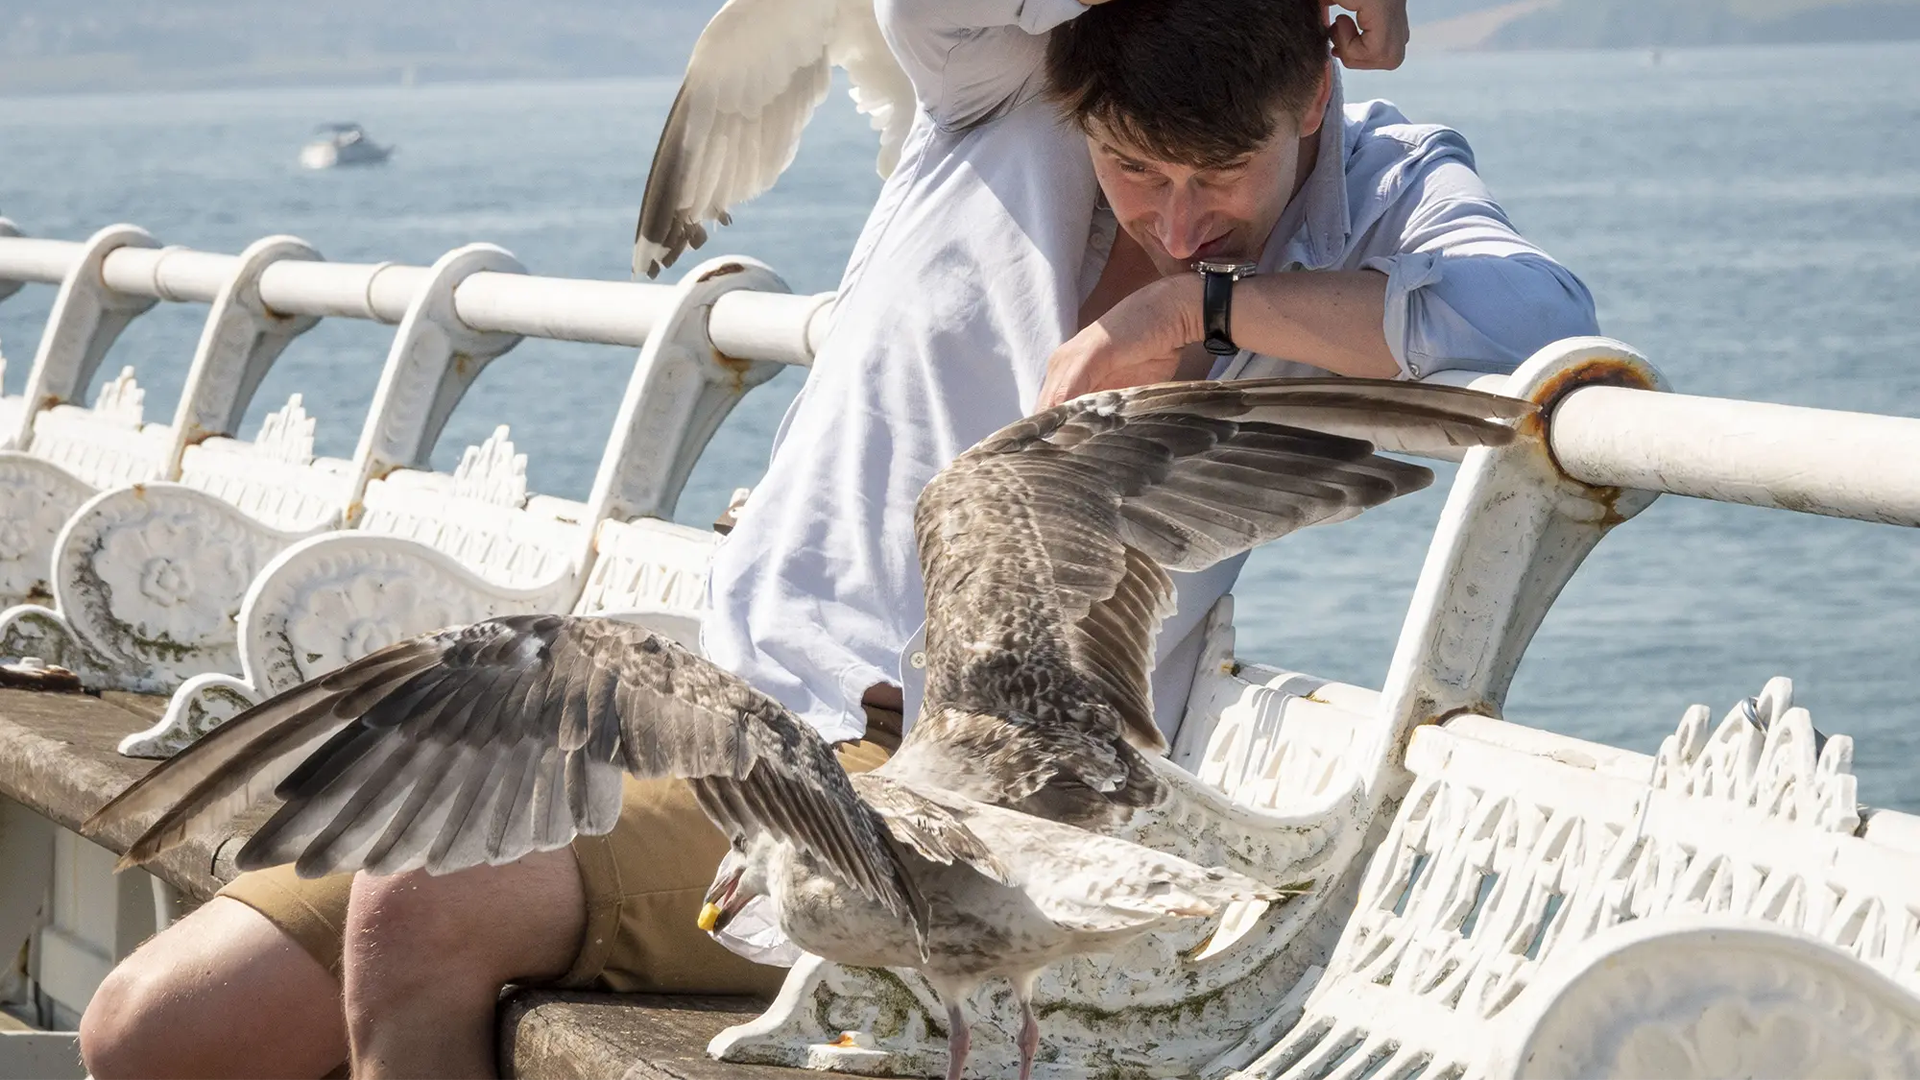
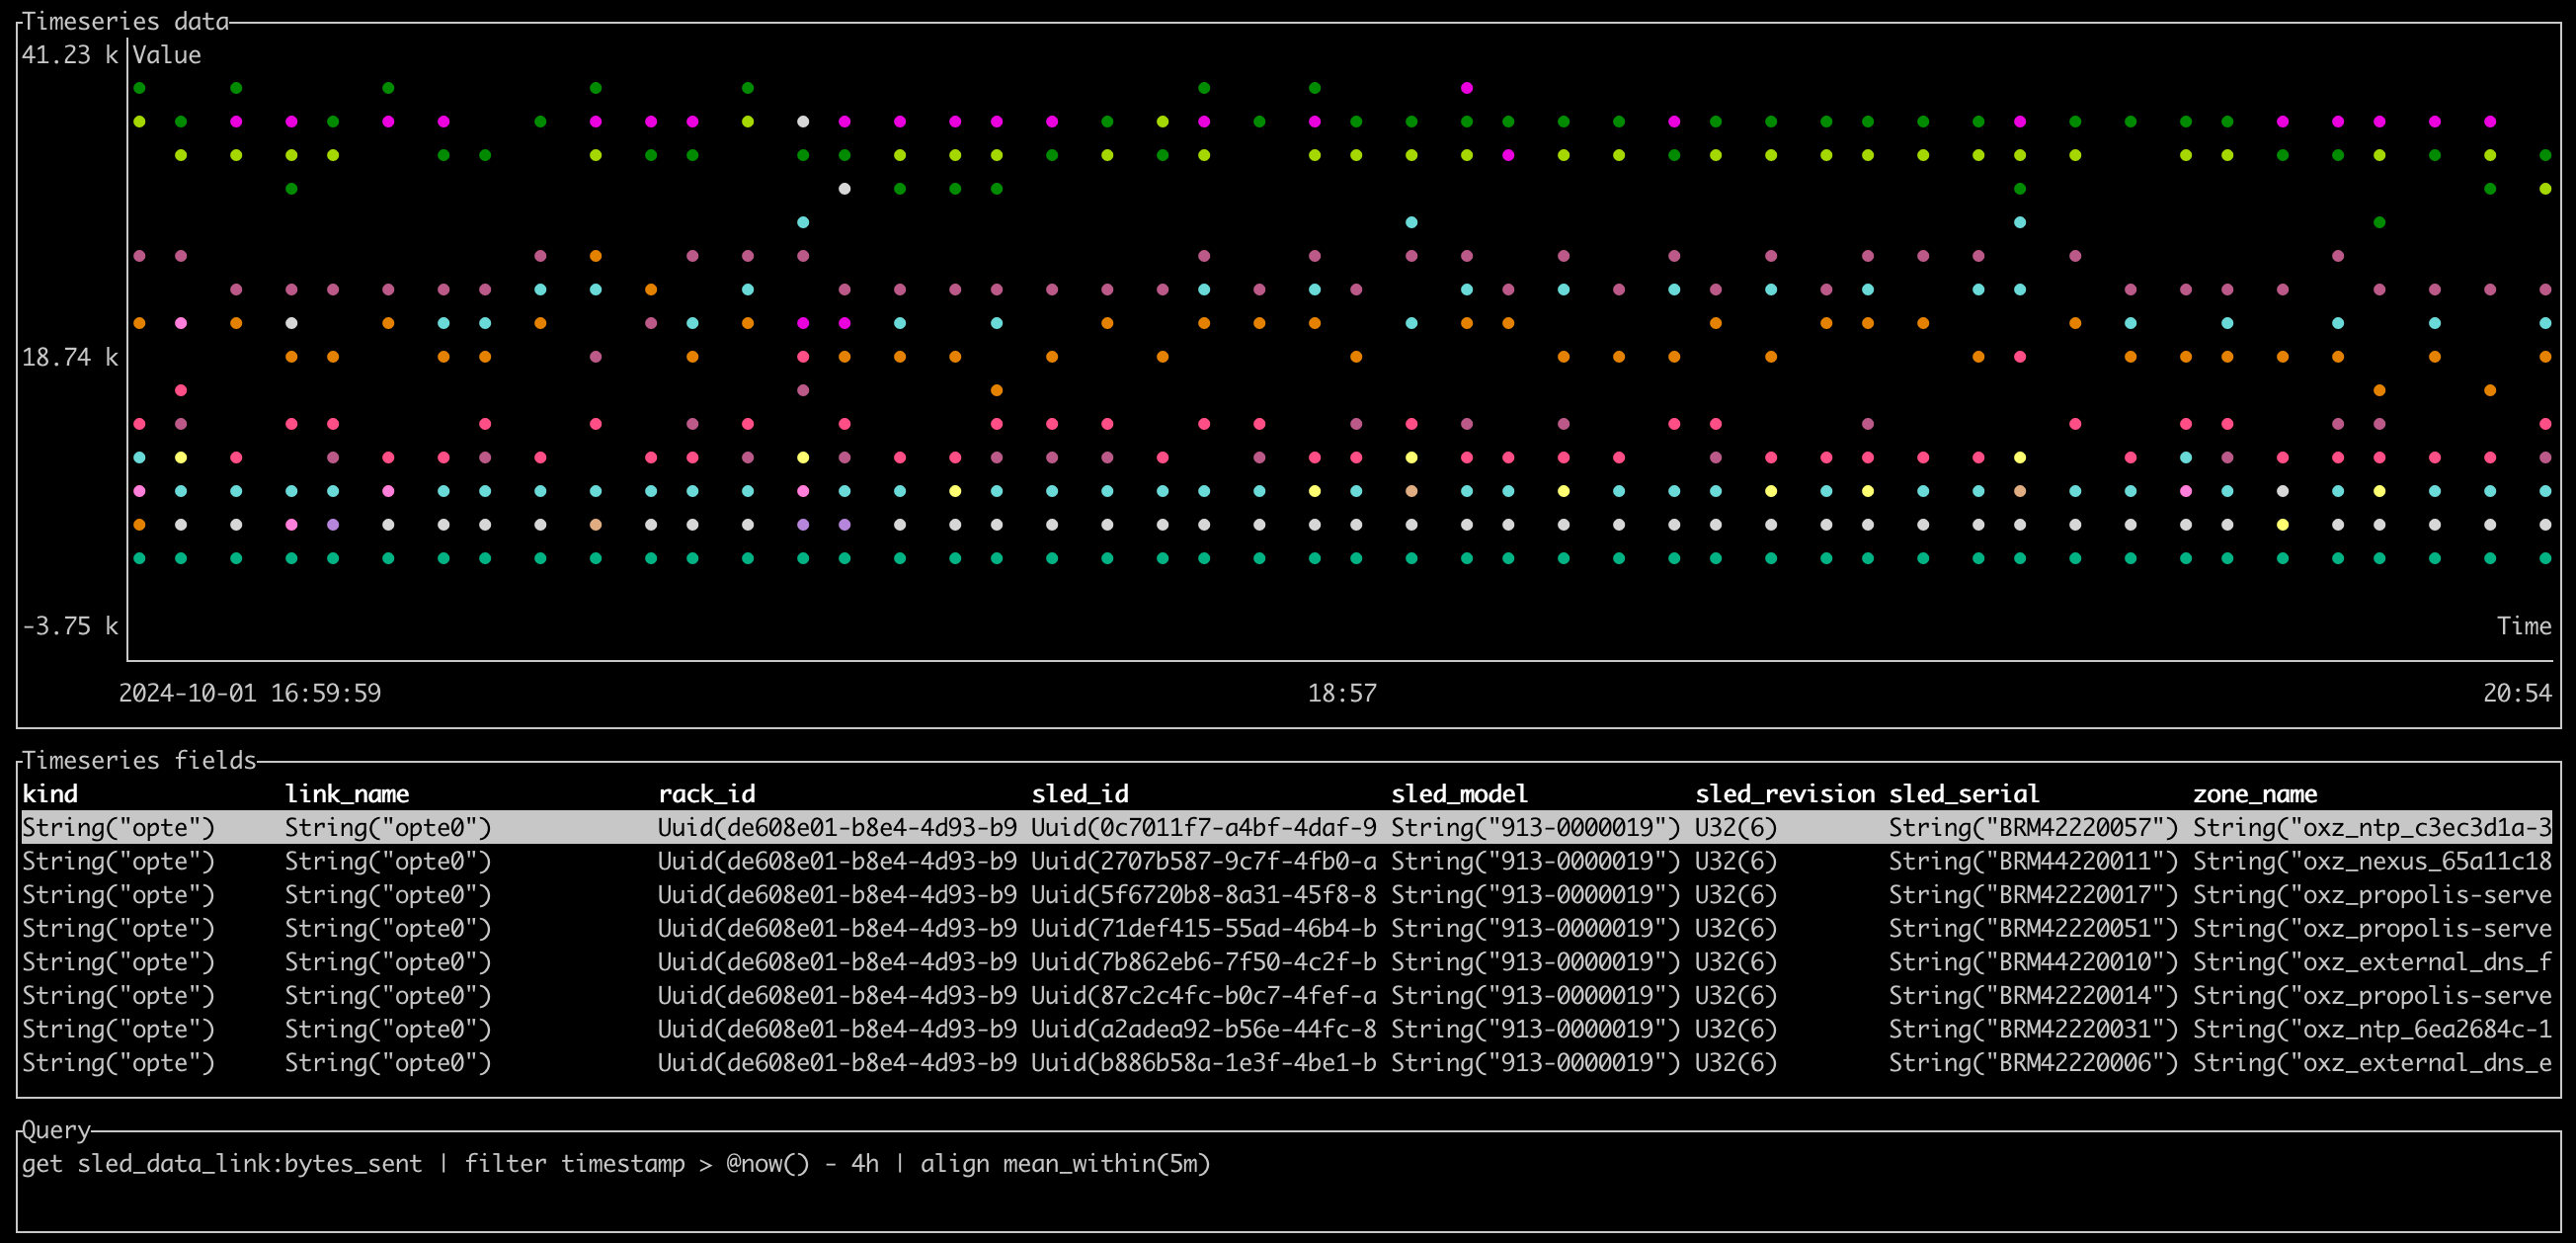
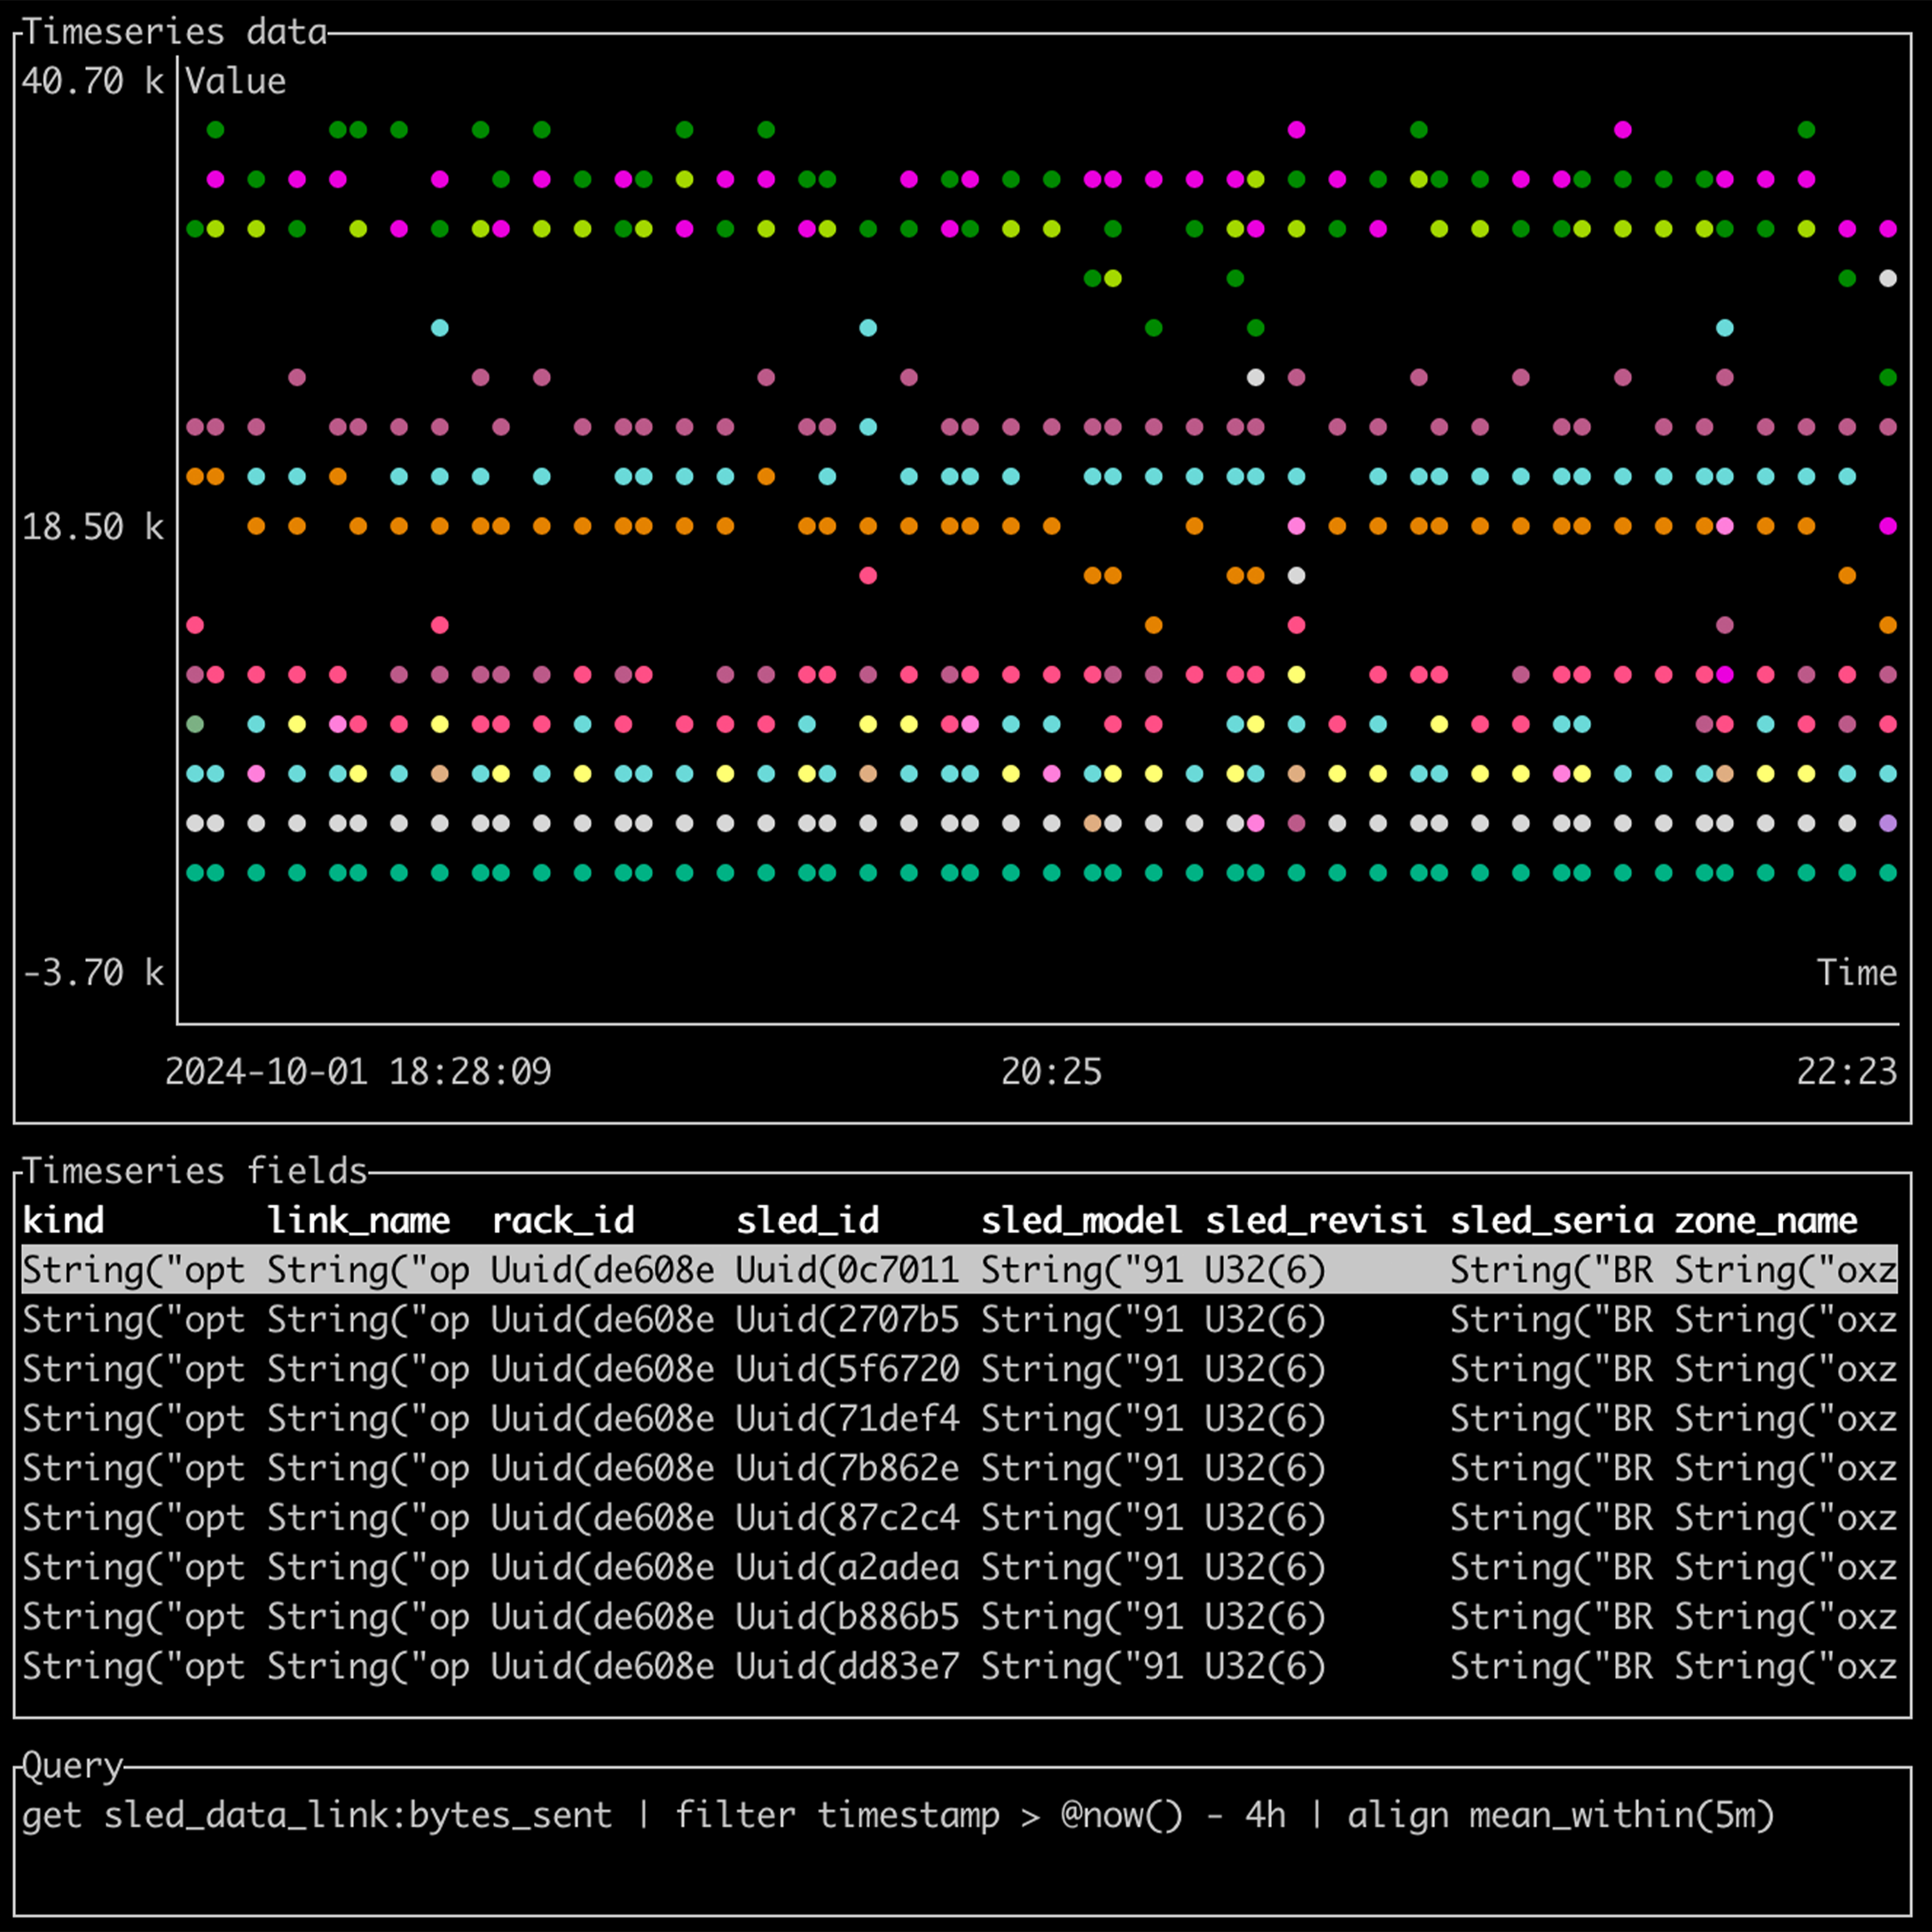
Alan showed the instrumentation and monitoring he and the Oxide storage team built for understanding how data flow through the system.
Aapo, relatively new to DTrace, had spent some time unearthing the history and mechanisms of DTrace USDT… presented in delightful narrative fashion!
Nahum shared his work integrating OpenTelemetry with Dropshot.
Dave (the man, the myth, the legend) provided resources for users learning DTrace. This is a great talk for anyone looking to get started.
Kris, our invited speaker from Oracle, presented the work he and his team did porting DTrace to an eBPF backend on Linux. This is an incredible advancement for both DTrace and eBPF users.
Ry gave an amazing talk on integrating P4 and DTrace.
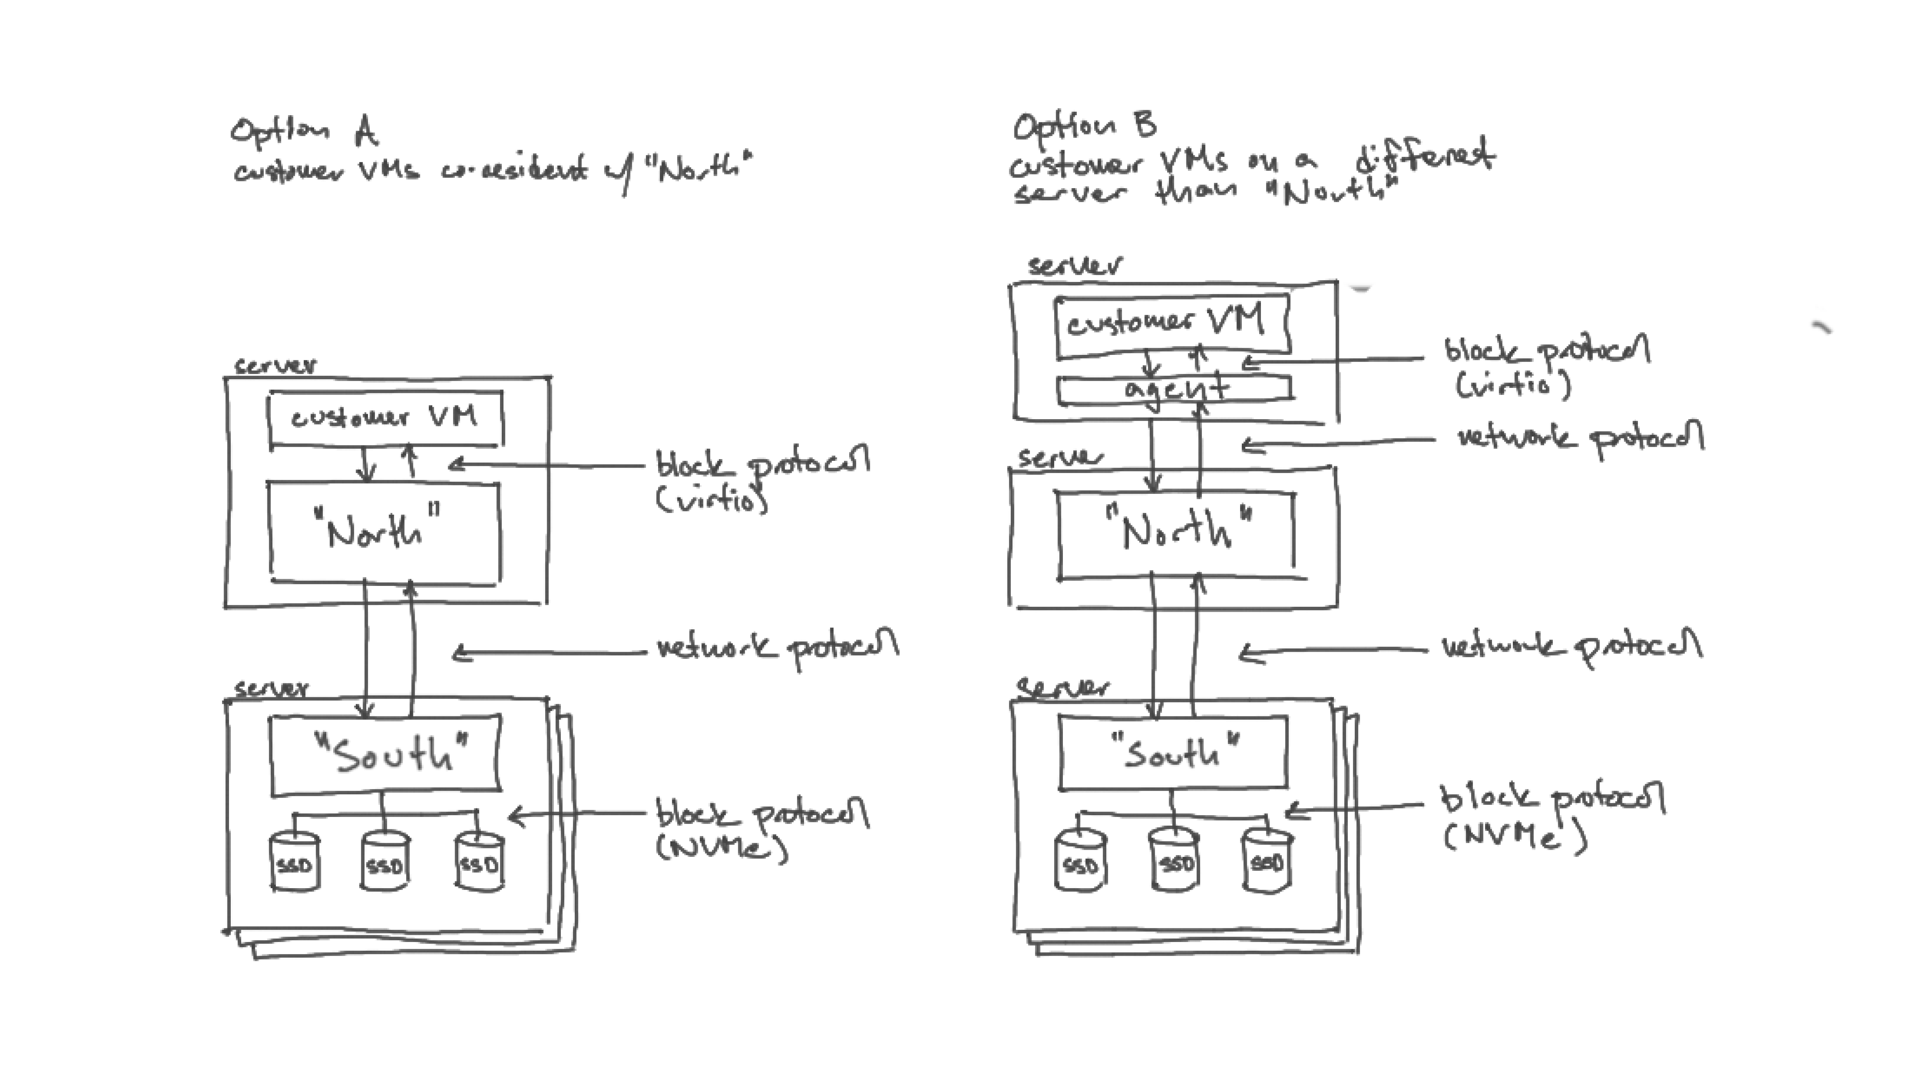
Robert presented a future for user-land tracing with DTrace that’s both exciting and tantalizingly close at-hand.
Eliza—inspired by the proceedings—gave a last-minute talk on the confluence of Tokio Tracing and DTrace.
Luqman found a long-standing but in kernel SDT in the presence of probes in tail-call context. He walked us through the discovery and the fix.
And finally, Bryan and I closed it out with a recap of the day.
Thanks to everyone who helped make the day possible, especially Kevin, Ben, and Matthew!
DTrace at Rustlab 2024
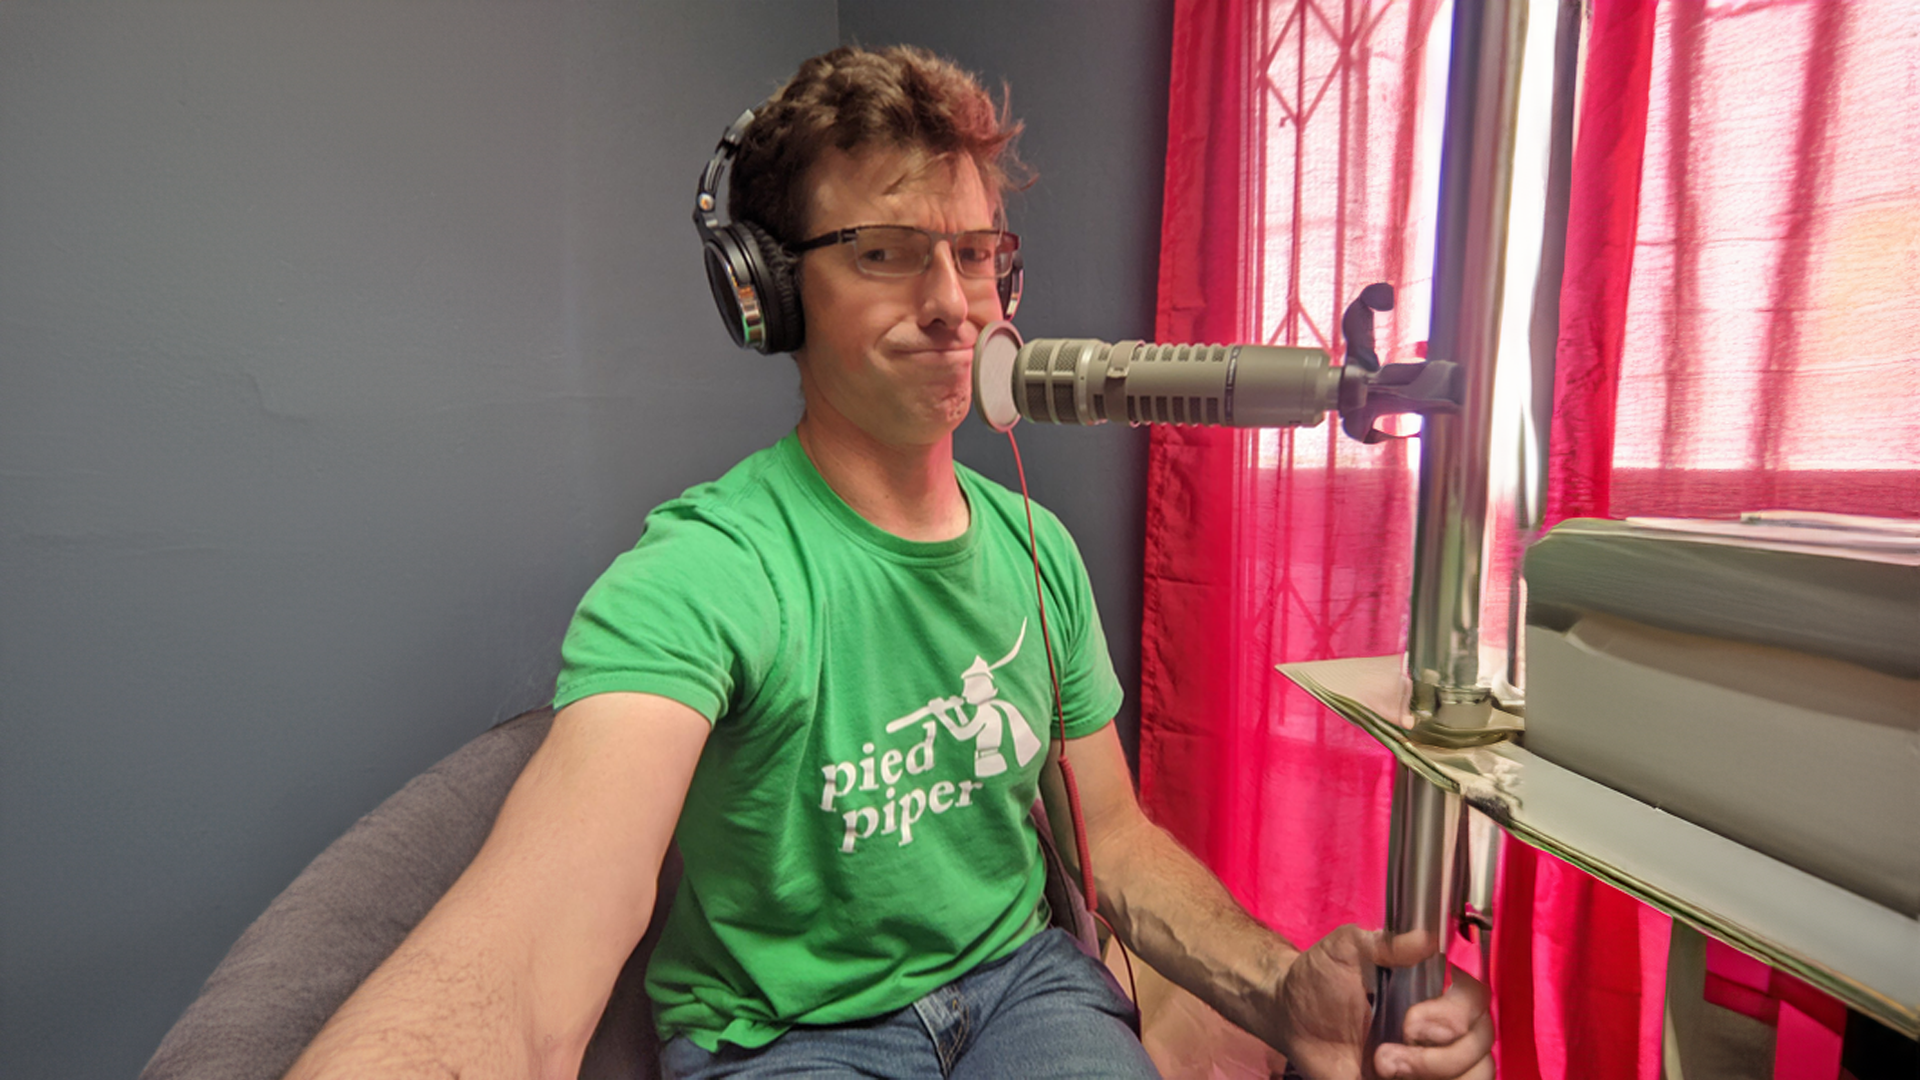
I gave a talk at Rustlab this past November about work my colleague, Ben Naecker, and I did to add DTrace USDT (user-land statically defined tracing) probes to our Rust code. I’ve given a lot of talks about DTrace over the years; I only realized as I got on stage how excited I was to talk about the confluence of DTrace and Rust… and to an audience that may have never seen DTrace in use. I got to go deep (maybe too deep) into the details of making our usdt crate have zero disabled probe-effect**—a principle of DTrace analogous to Rust’s principle of zero-cost abstractions.
Need an endorsement of the talk? A C++ programmer in the audience remarked after the talk that he was inspired to learn Rust. (This was my son. He also offered the carefully constructed observation, “the audience seemed to enjoy your jokes.” Which parents of college-aged students will recognize for the encomium that it is.)
Florence
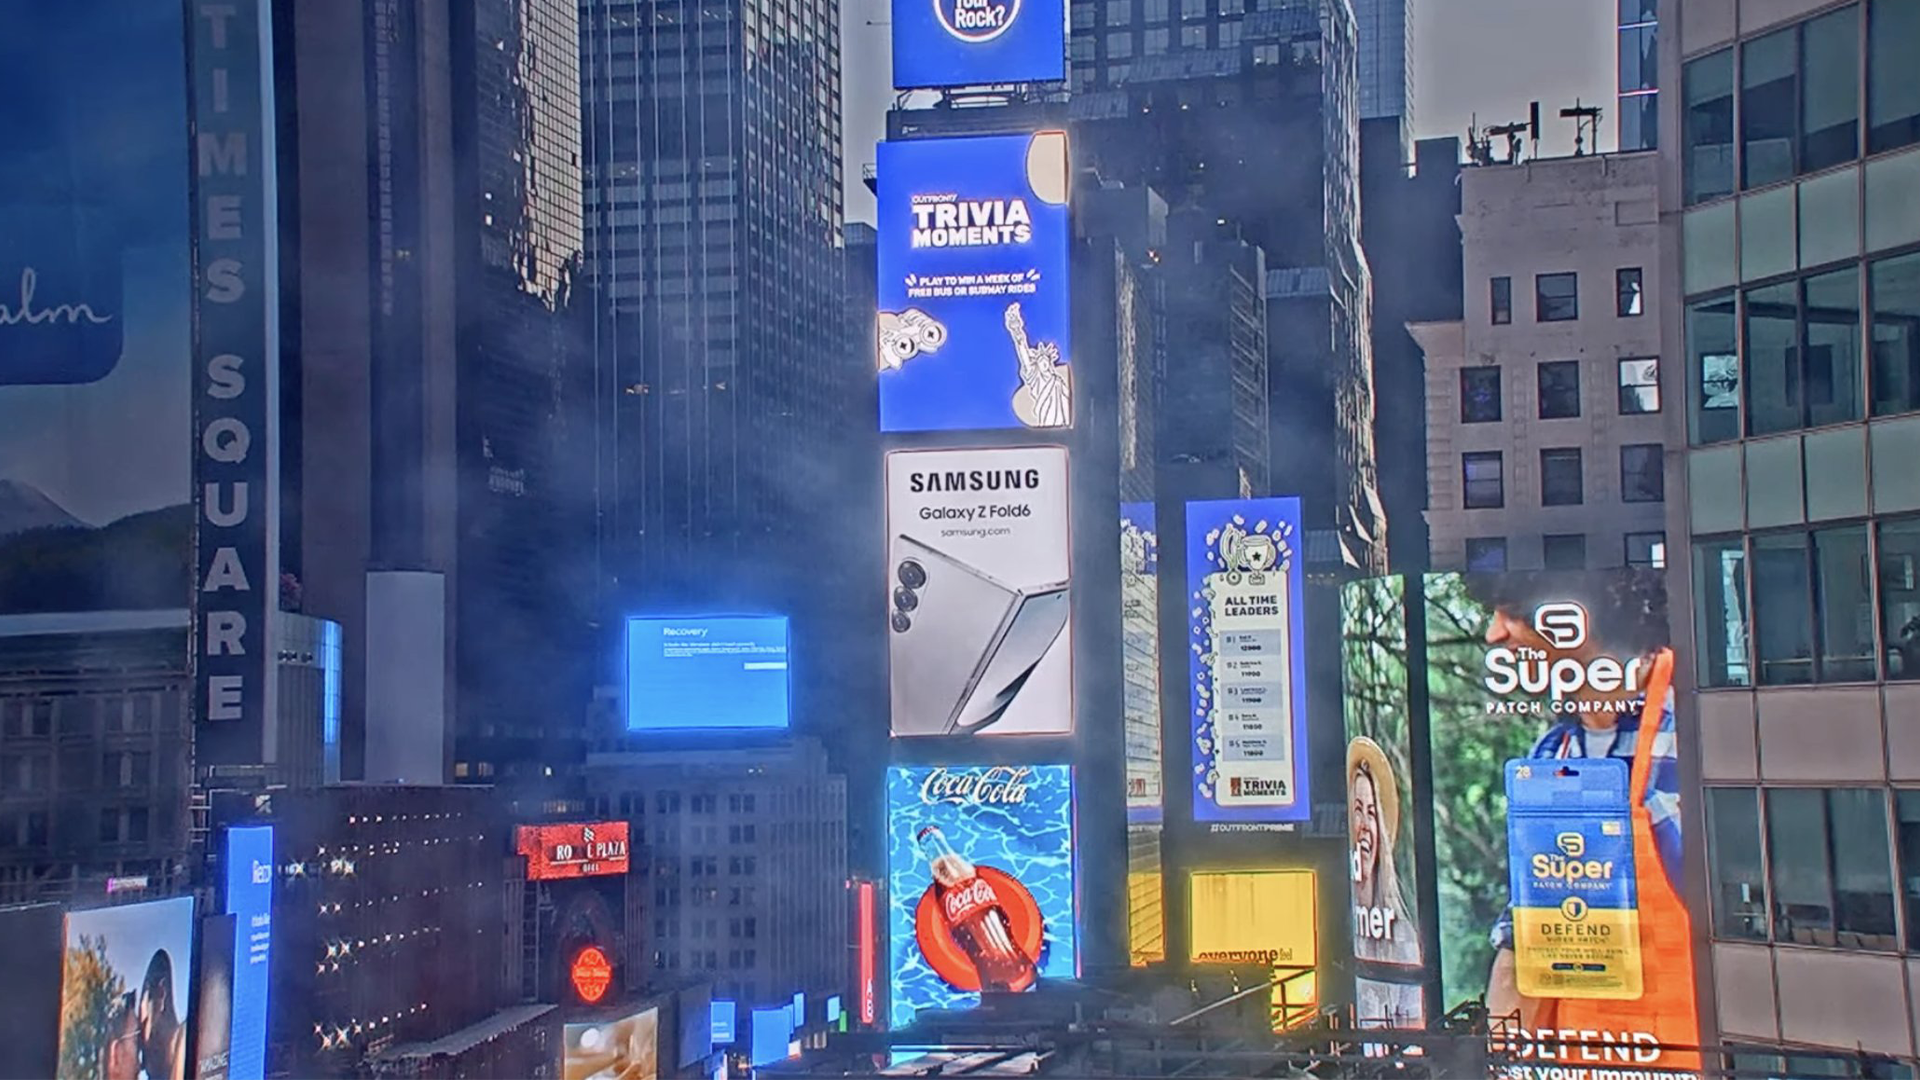
This summer I traveled with my family to Florence to drop off my older boy at his study abroad program. I even got to record an episode of Oxide and Friends abroad.
Florence was wonderful! I idly started thinking if there might be a good reason to visit again during the semester. This quickly turned up Rustlab. A Rust conference in Florence? It didn’t even take much imagination to justify the trip! The organizers even had a DTrace+Rust-sized hole in their agenda.
Rustlab
The conference was great: good folks, well-run, good talks, and in a delightful location. In a recent Oxide and Friends, we talked about conferences in tech. A lot of them have gone online, and—compared with decades ago—there are many other opportunities to congregate without traveling, but there’s something delightful about meeting with folks in-person. Rustlab had a great hallway track. I got to hang out with Tim McNamara, Rust luminary and social media pal (Tim gave a great keynote and web programming intro); Orhun Parmaksız, who works on ratatui, a textual user-interface crate that we use a ton at Oxide (and we’ll be having Orhun on OxF soon!); Paolo Barbolini, who I recognized from the OxF Discord, up well past midnight to catch the live shows; … to name a few.
Thanks to the organizers, speakers, and to everyone who attended my talk; I hope to make it back in the future.
** As someone astutely observed after my talk, the cost isn’t actually zero since there’s a register move, test, and branch; also there’s a bunch of additional program text that can impact caching. All true, but it’s the rare inner loop for which the impact would be measurable.